Shadcn Chart Blocks
Browse 30 Application Pro chart blocks for shadcn/ui. Revenue, usage, retention, and funnel charts built on the shadcn chart primitives.


Application Chart: Percent Stacked Bars
A card panel charting monthly signups by acquisition channel as bars normalized to 100 percent, so the chart reads as share of mix over volume.
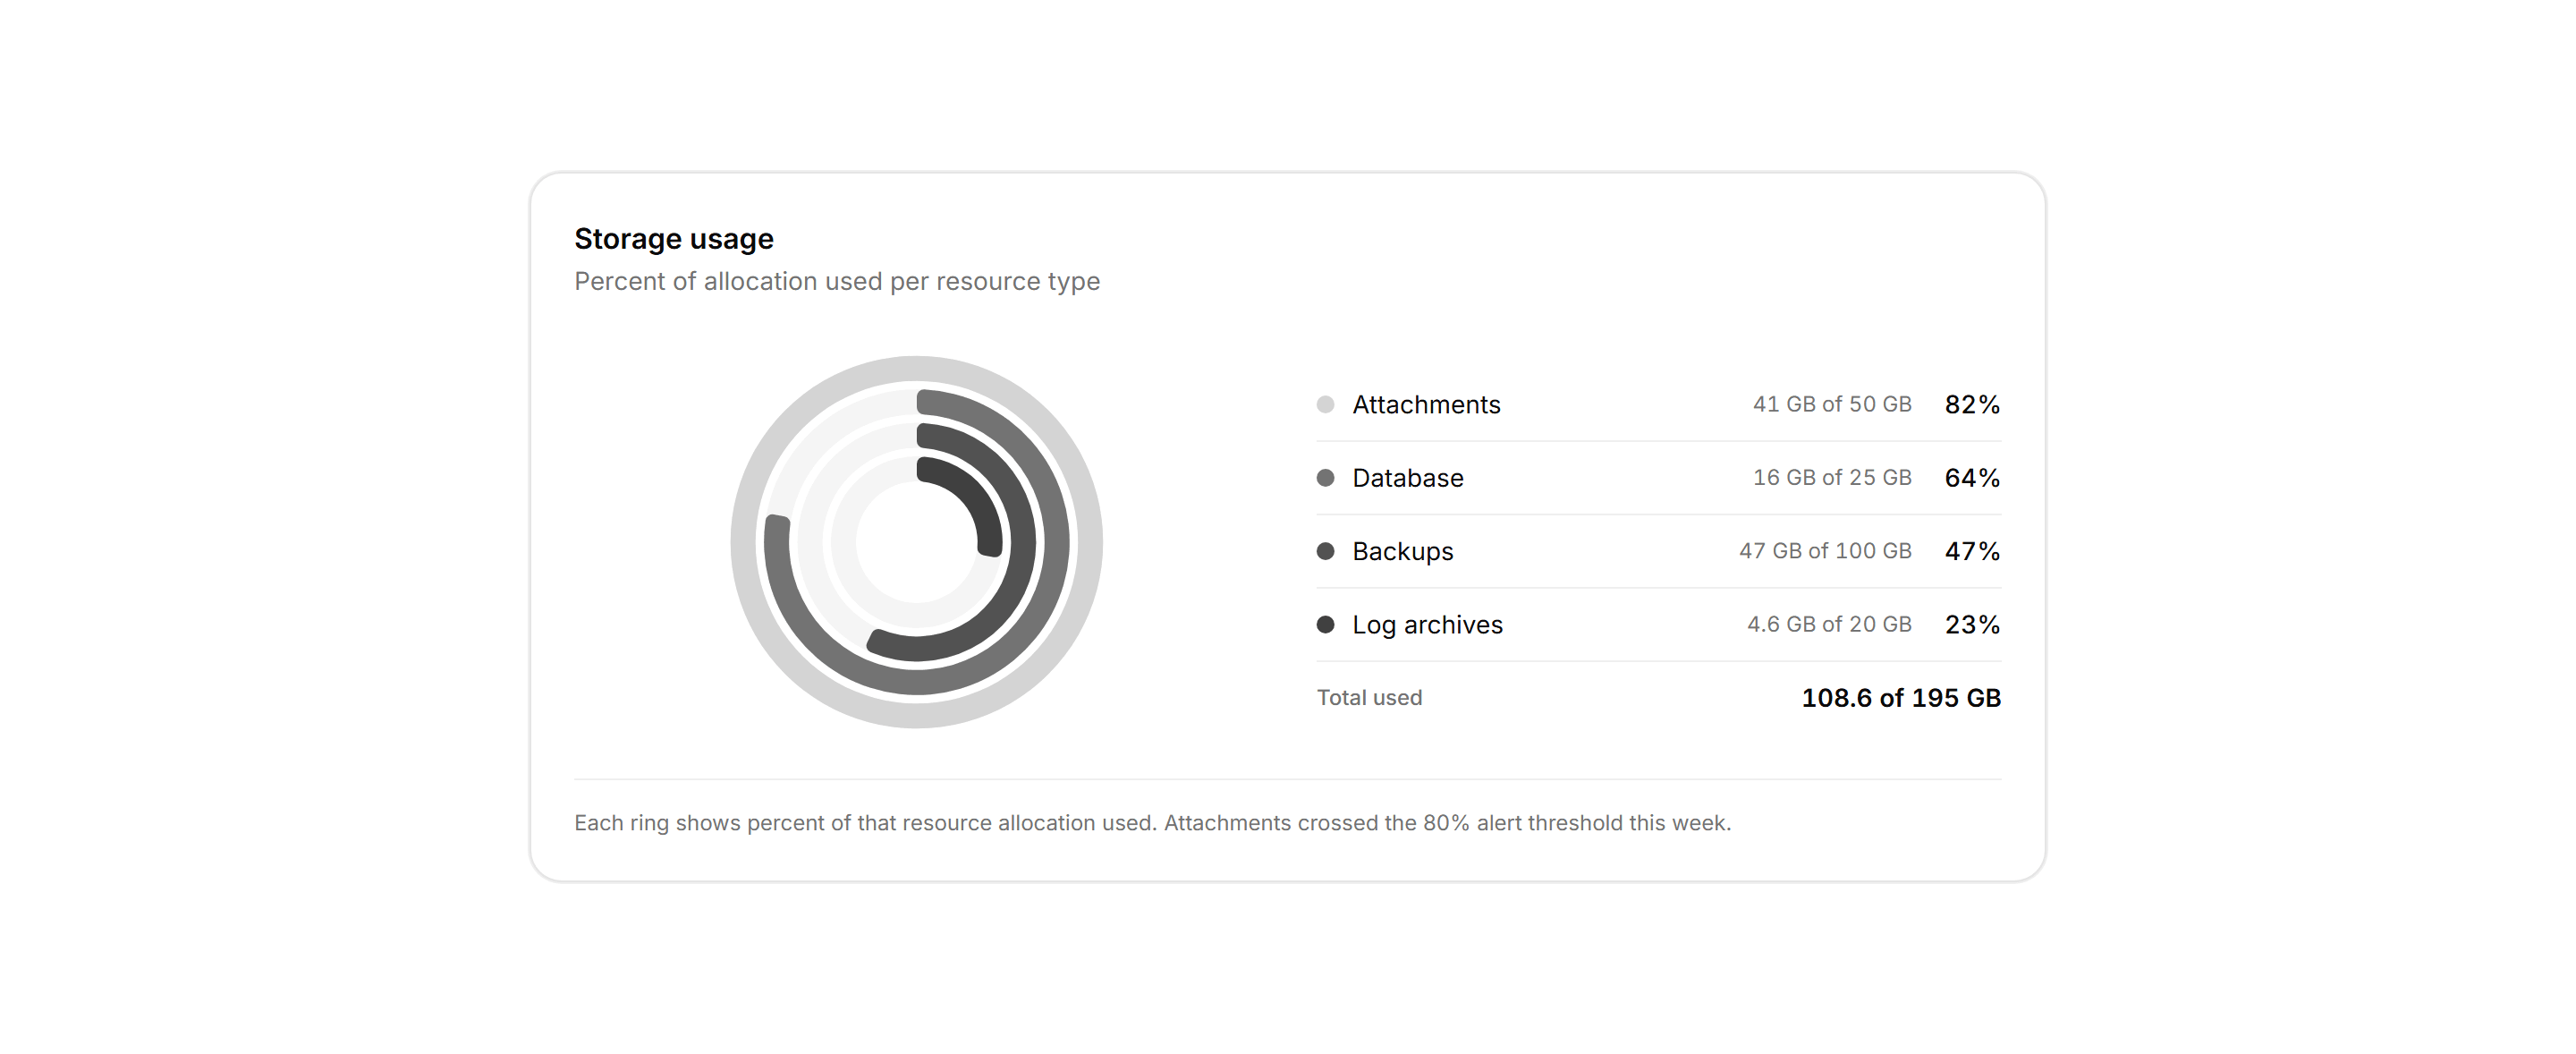

Application Chart: Radial Usage Rings
Concentric radial rings showing percent of quota used per storage resource beside a breakdown list with exact allocations.
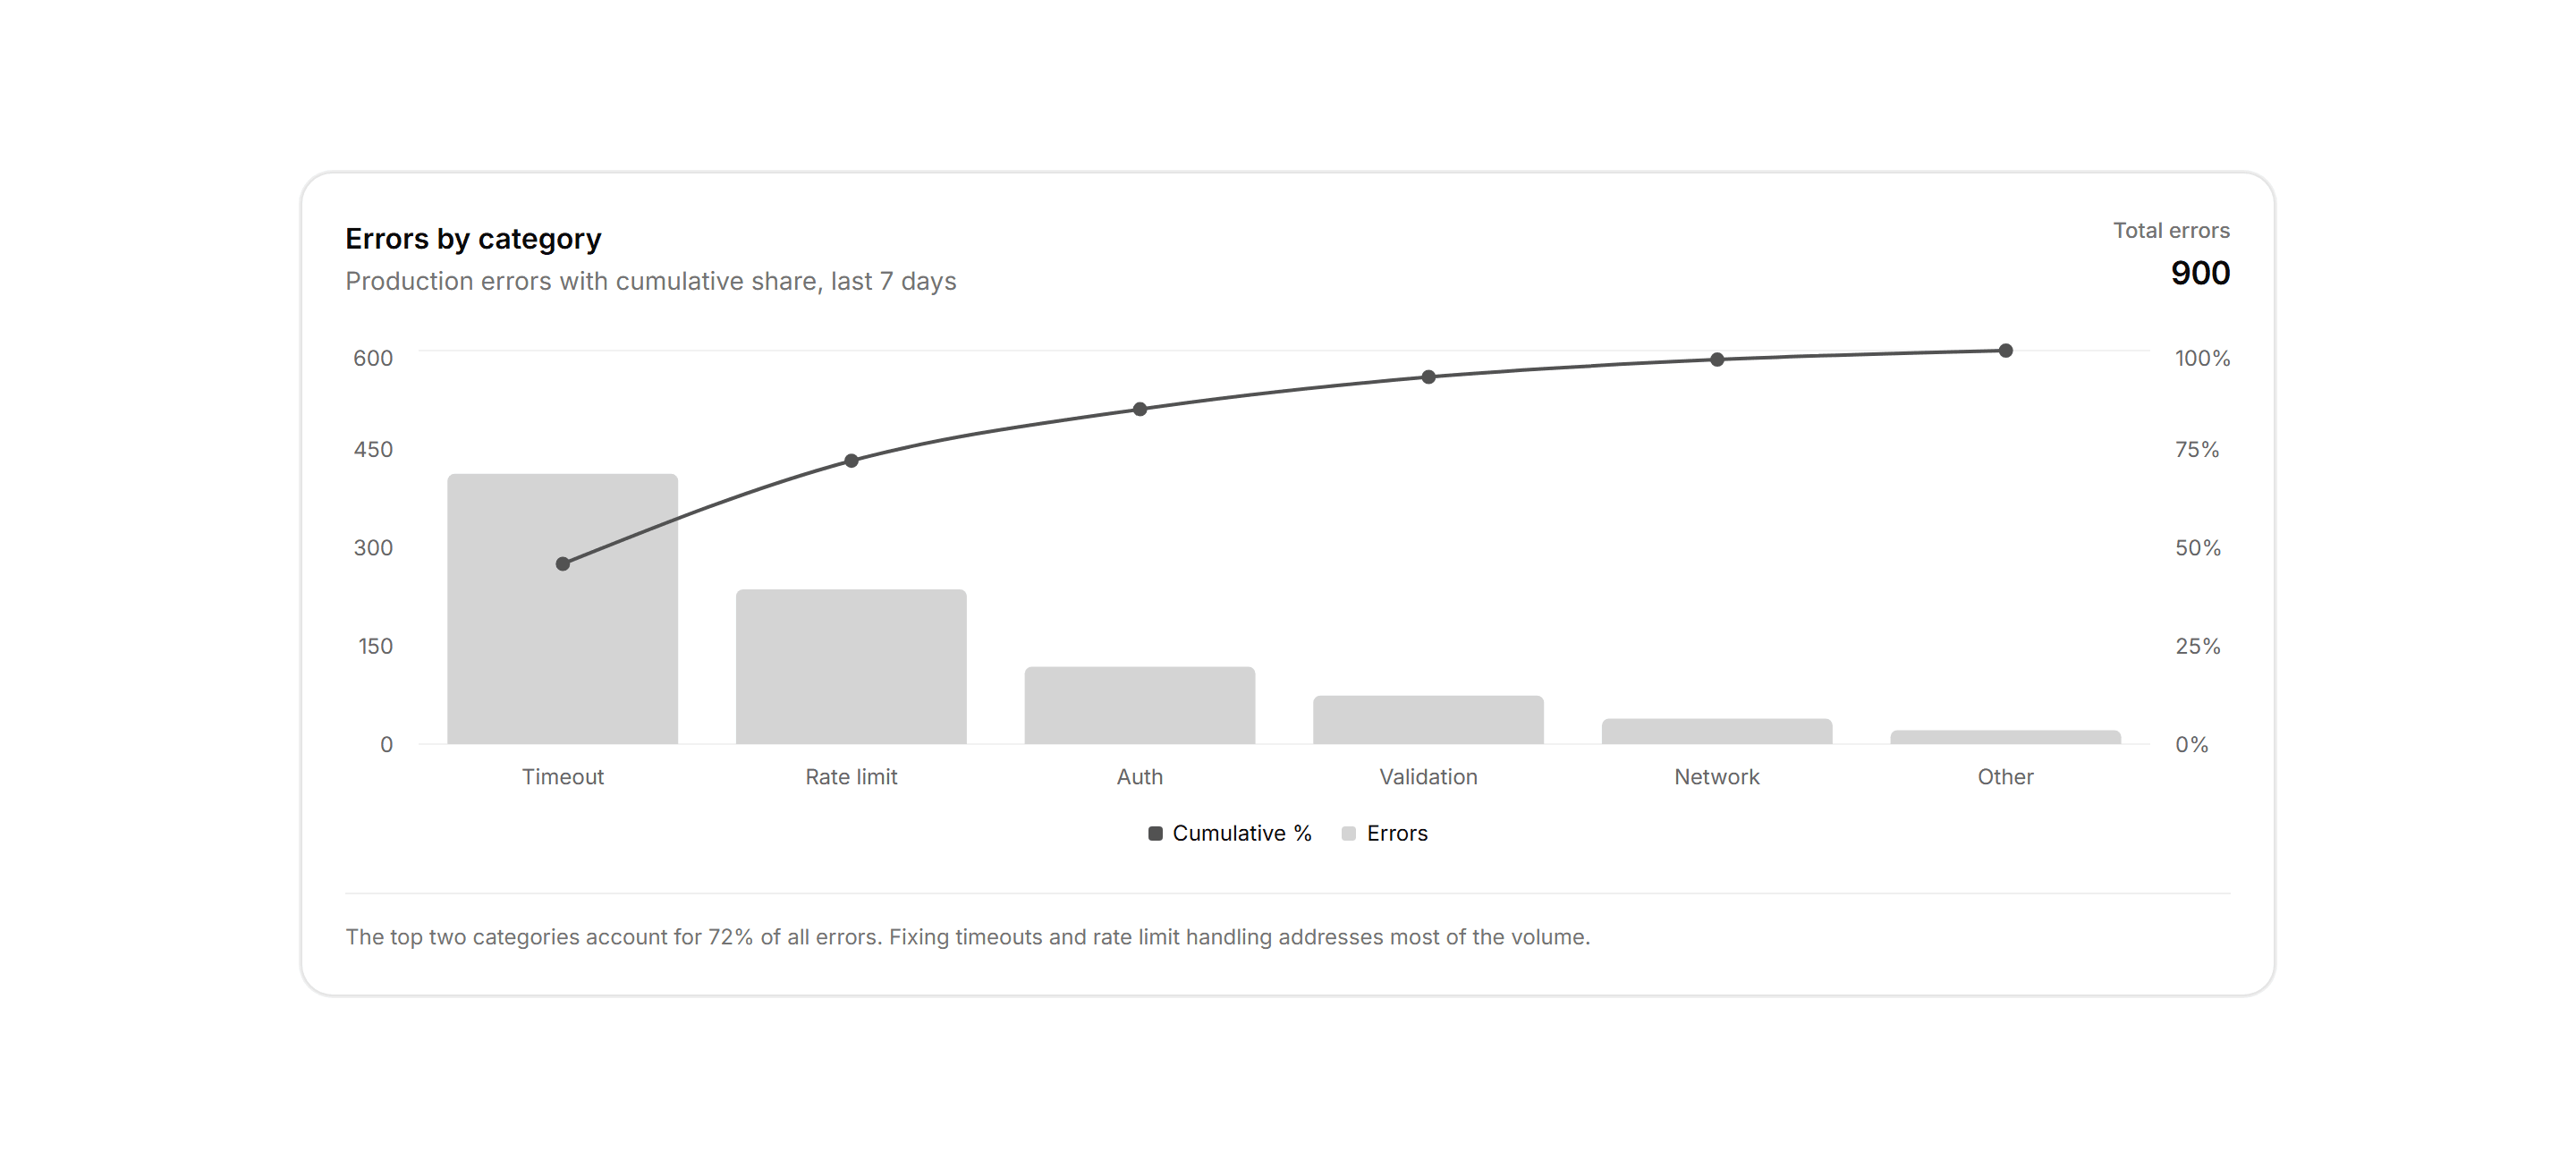

Application Chart: Pareto Error Chart
A Pareto chart pairing error category bars sorted by volume with a cumulative share line on a second percentage axis.
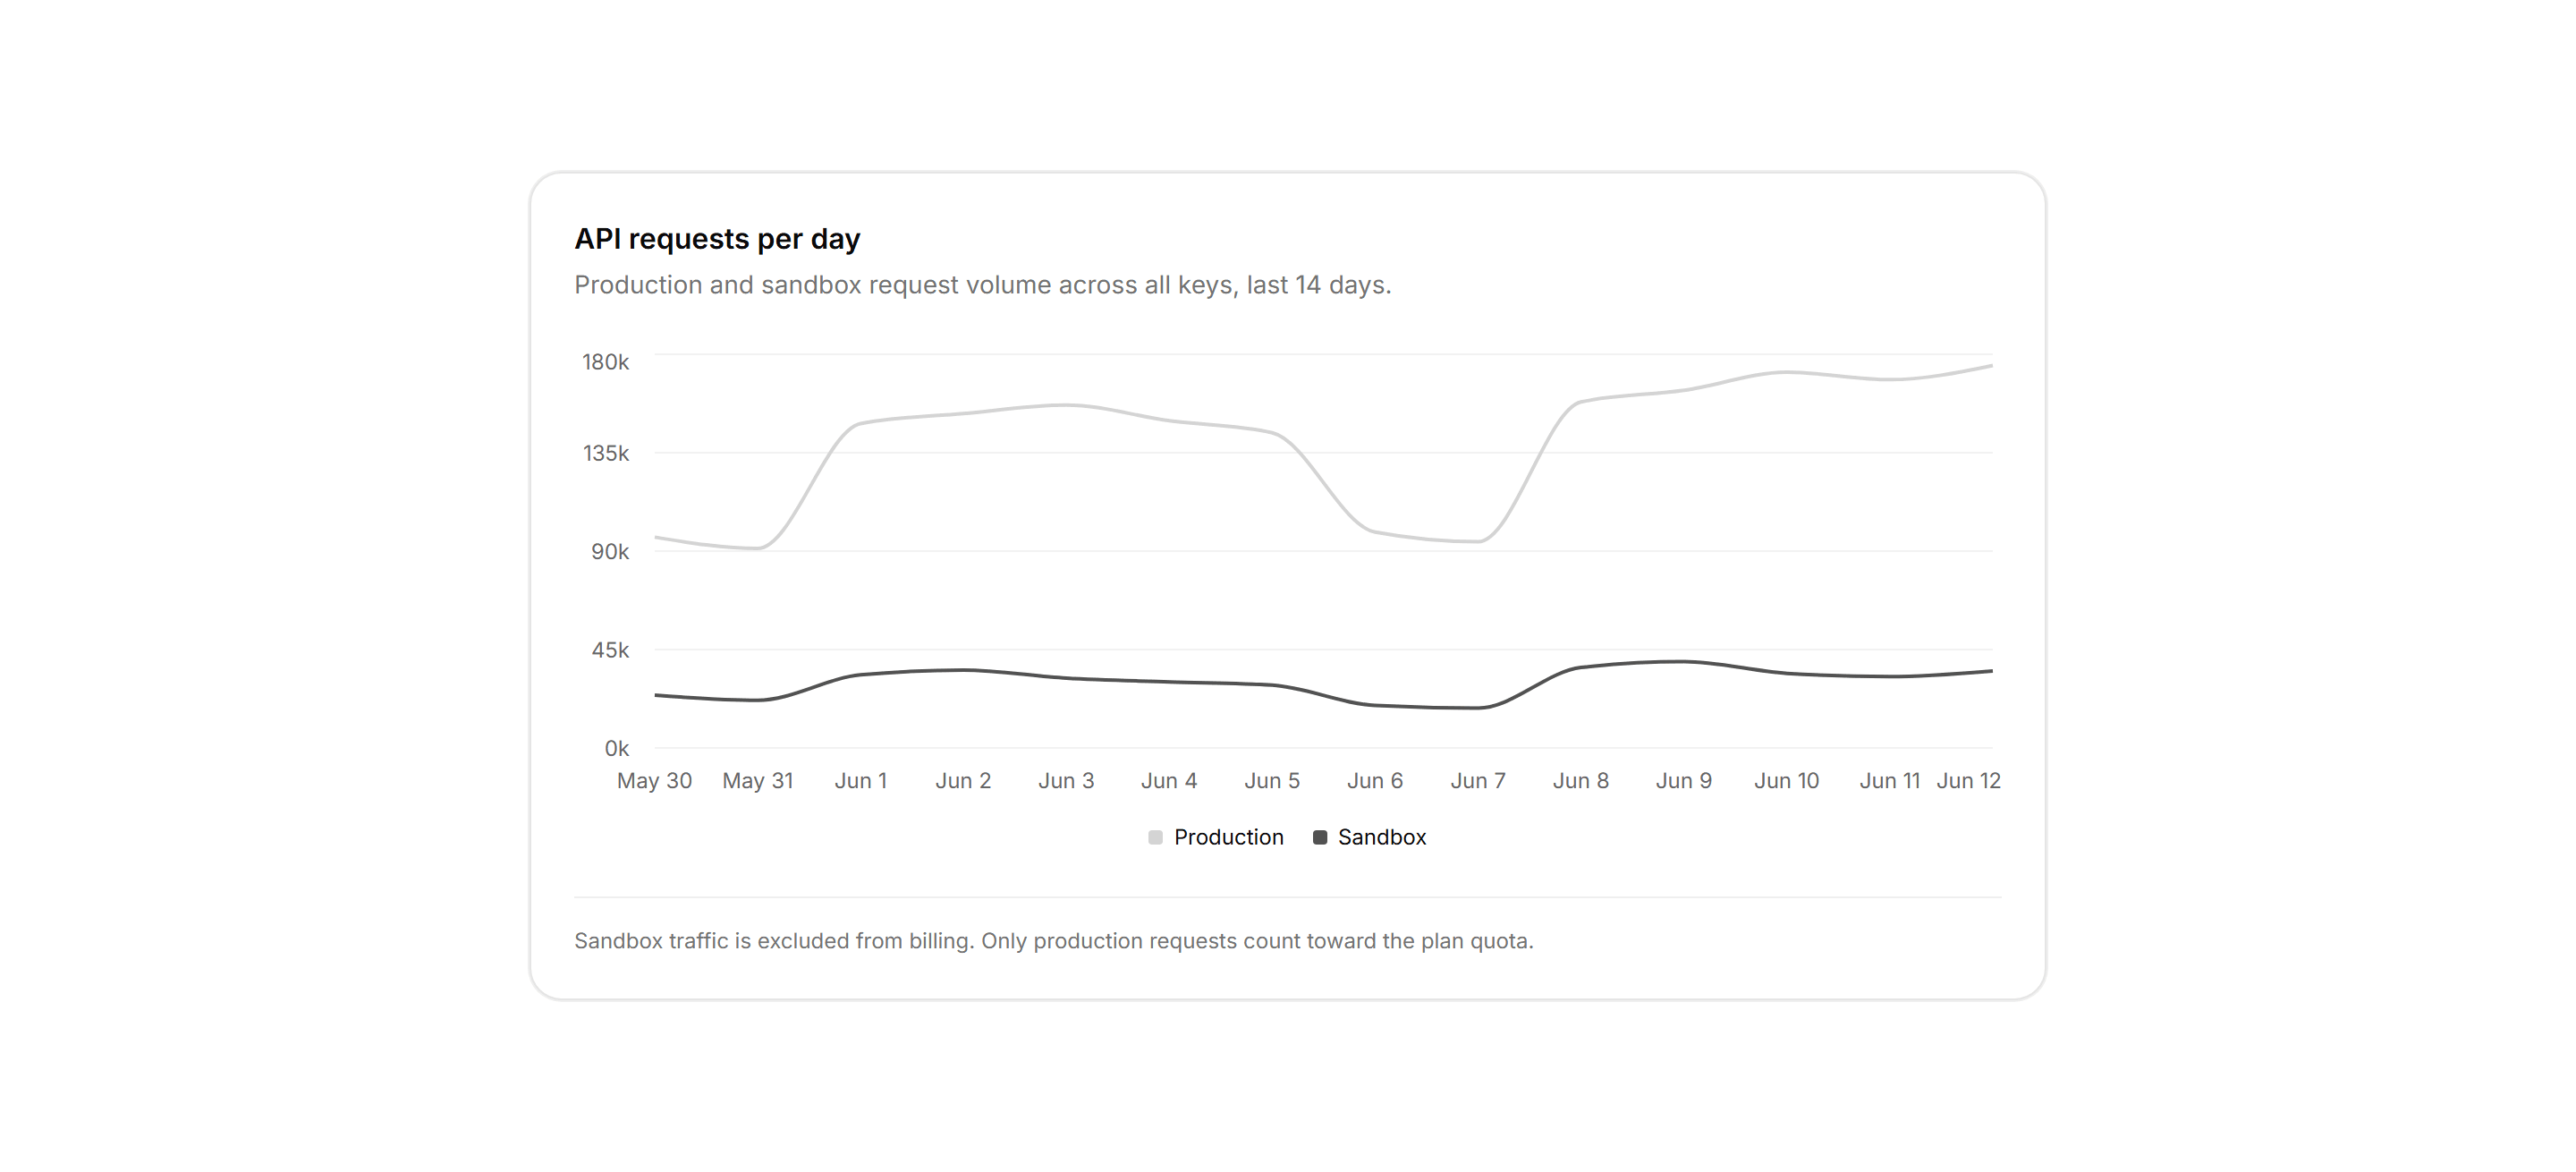
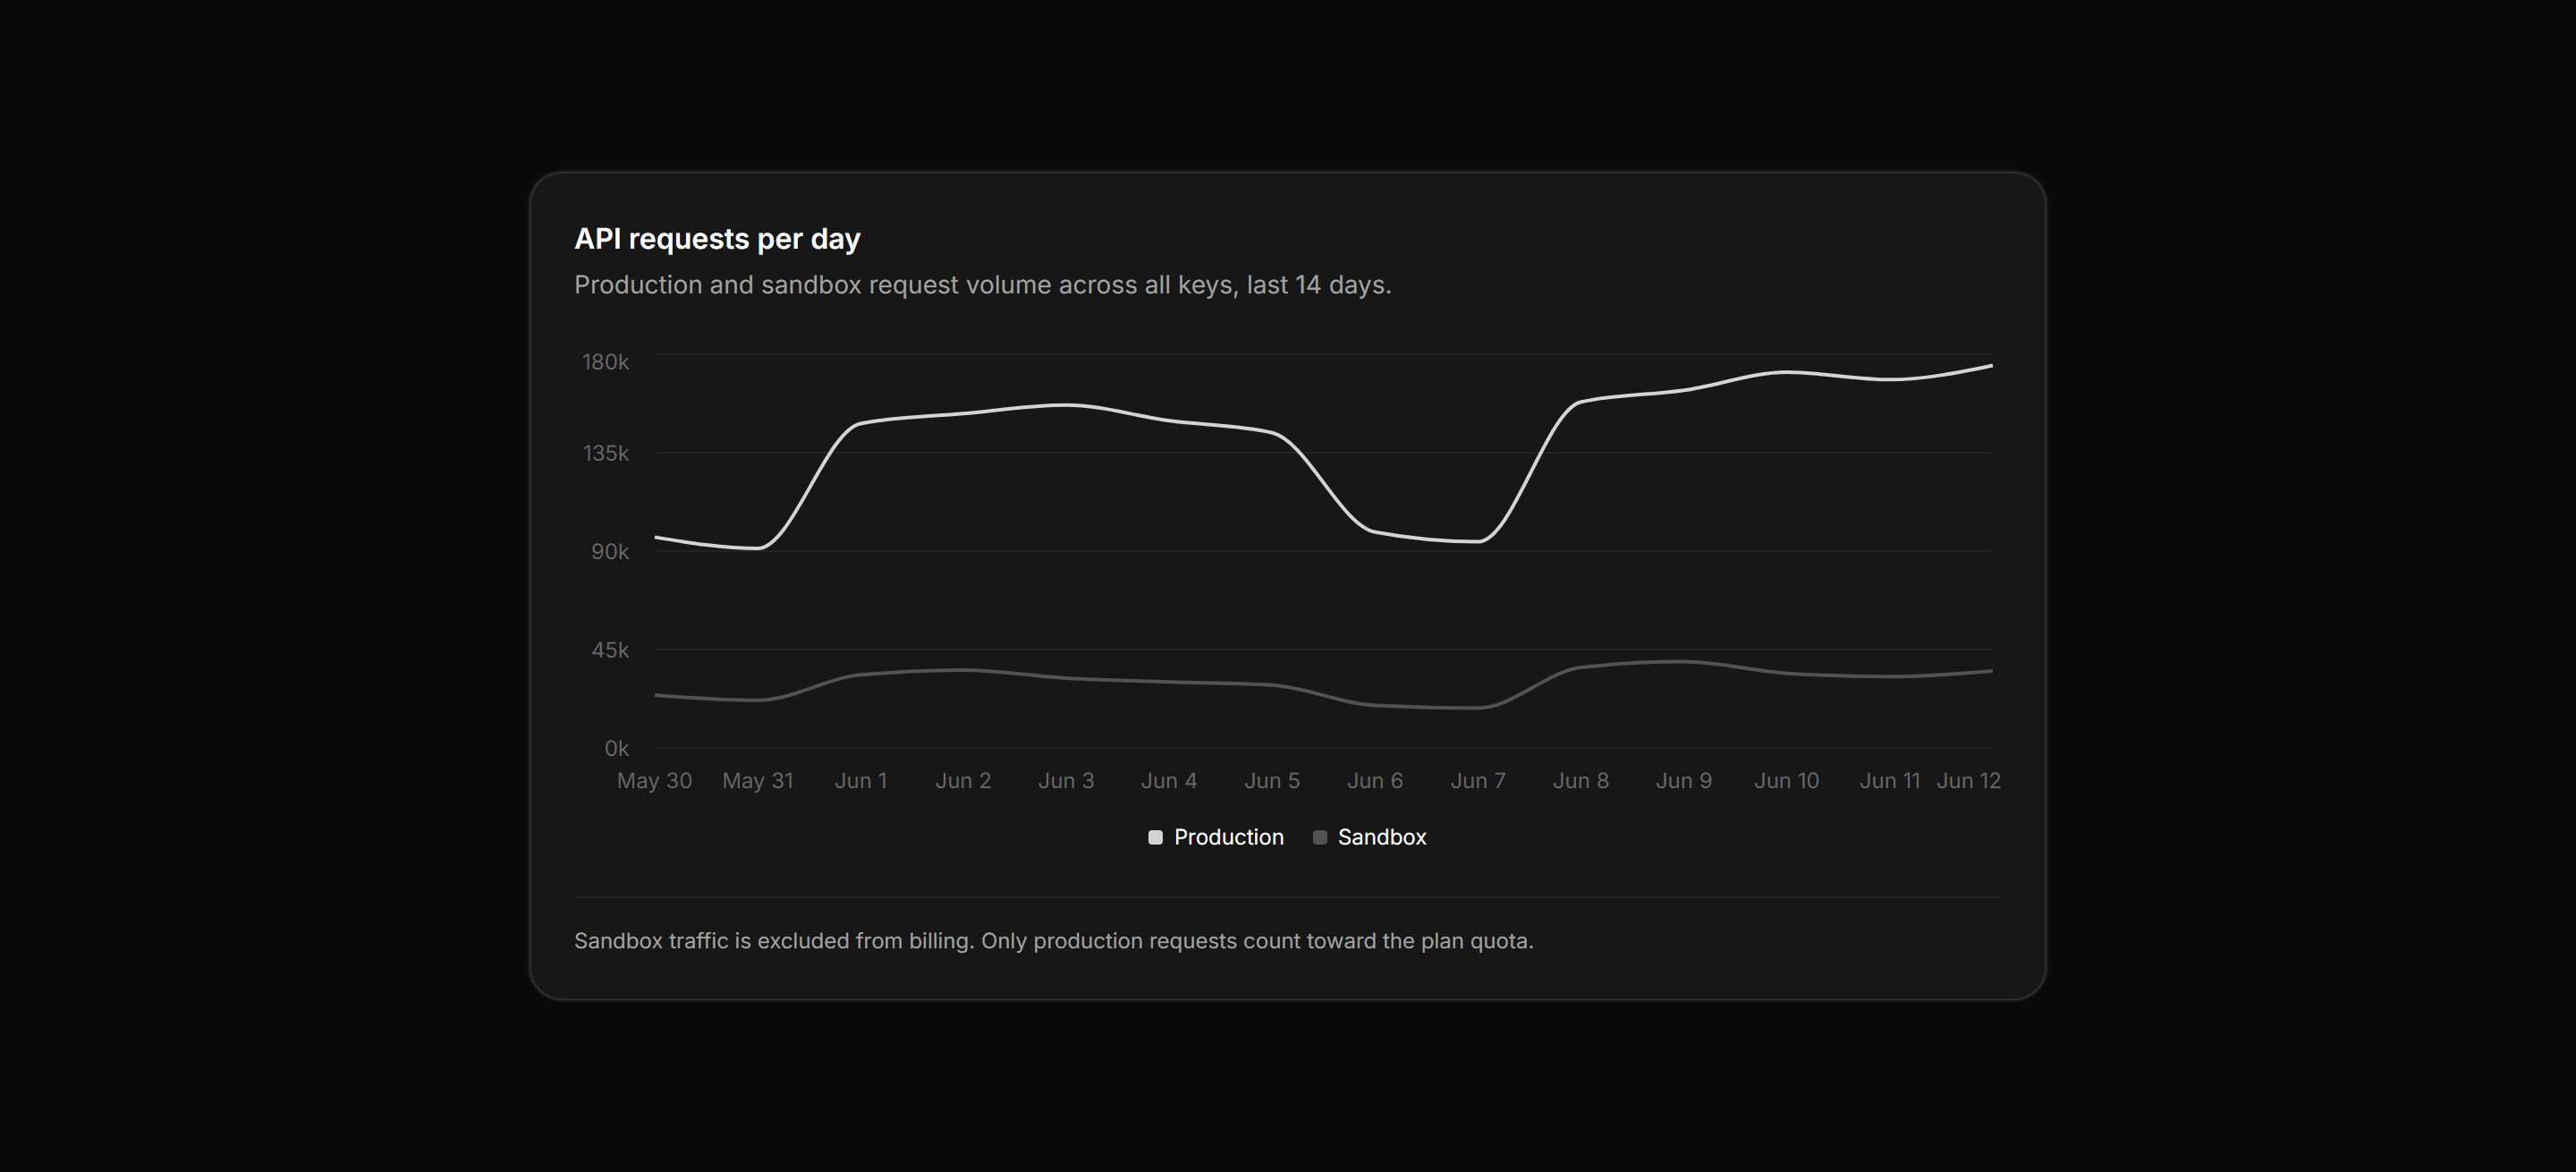
Application Chart: Usage Line Chart
API requests per day as two lines separating production and sandbox volume across a 14 day window.

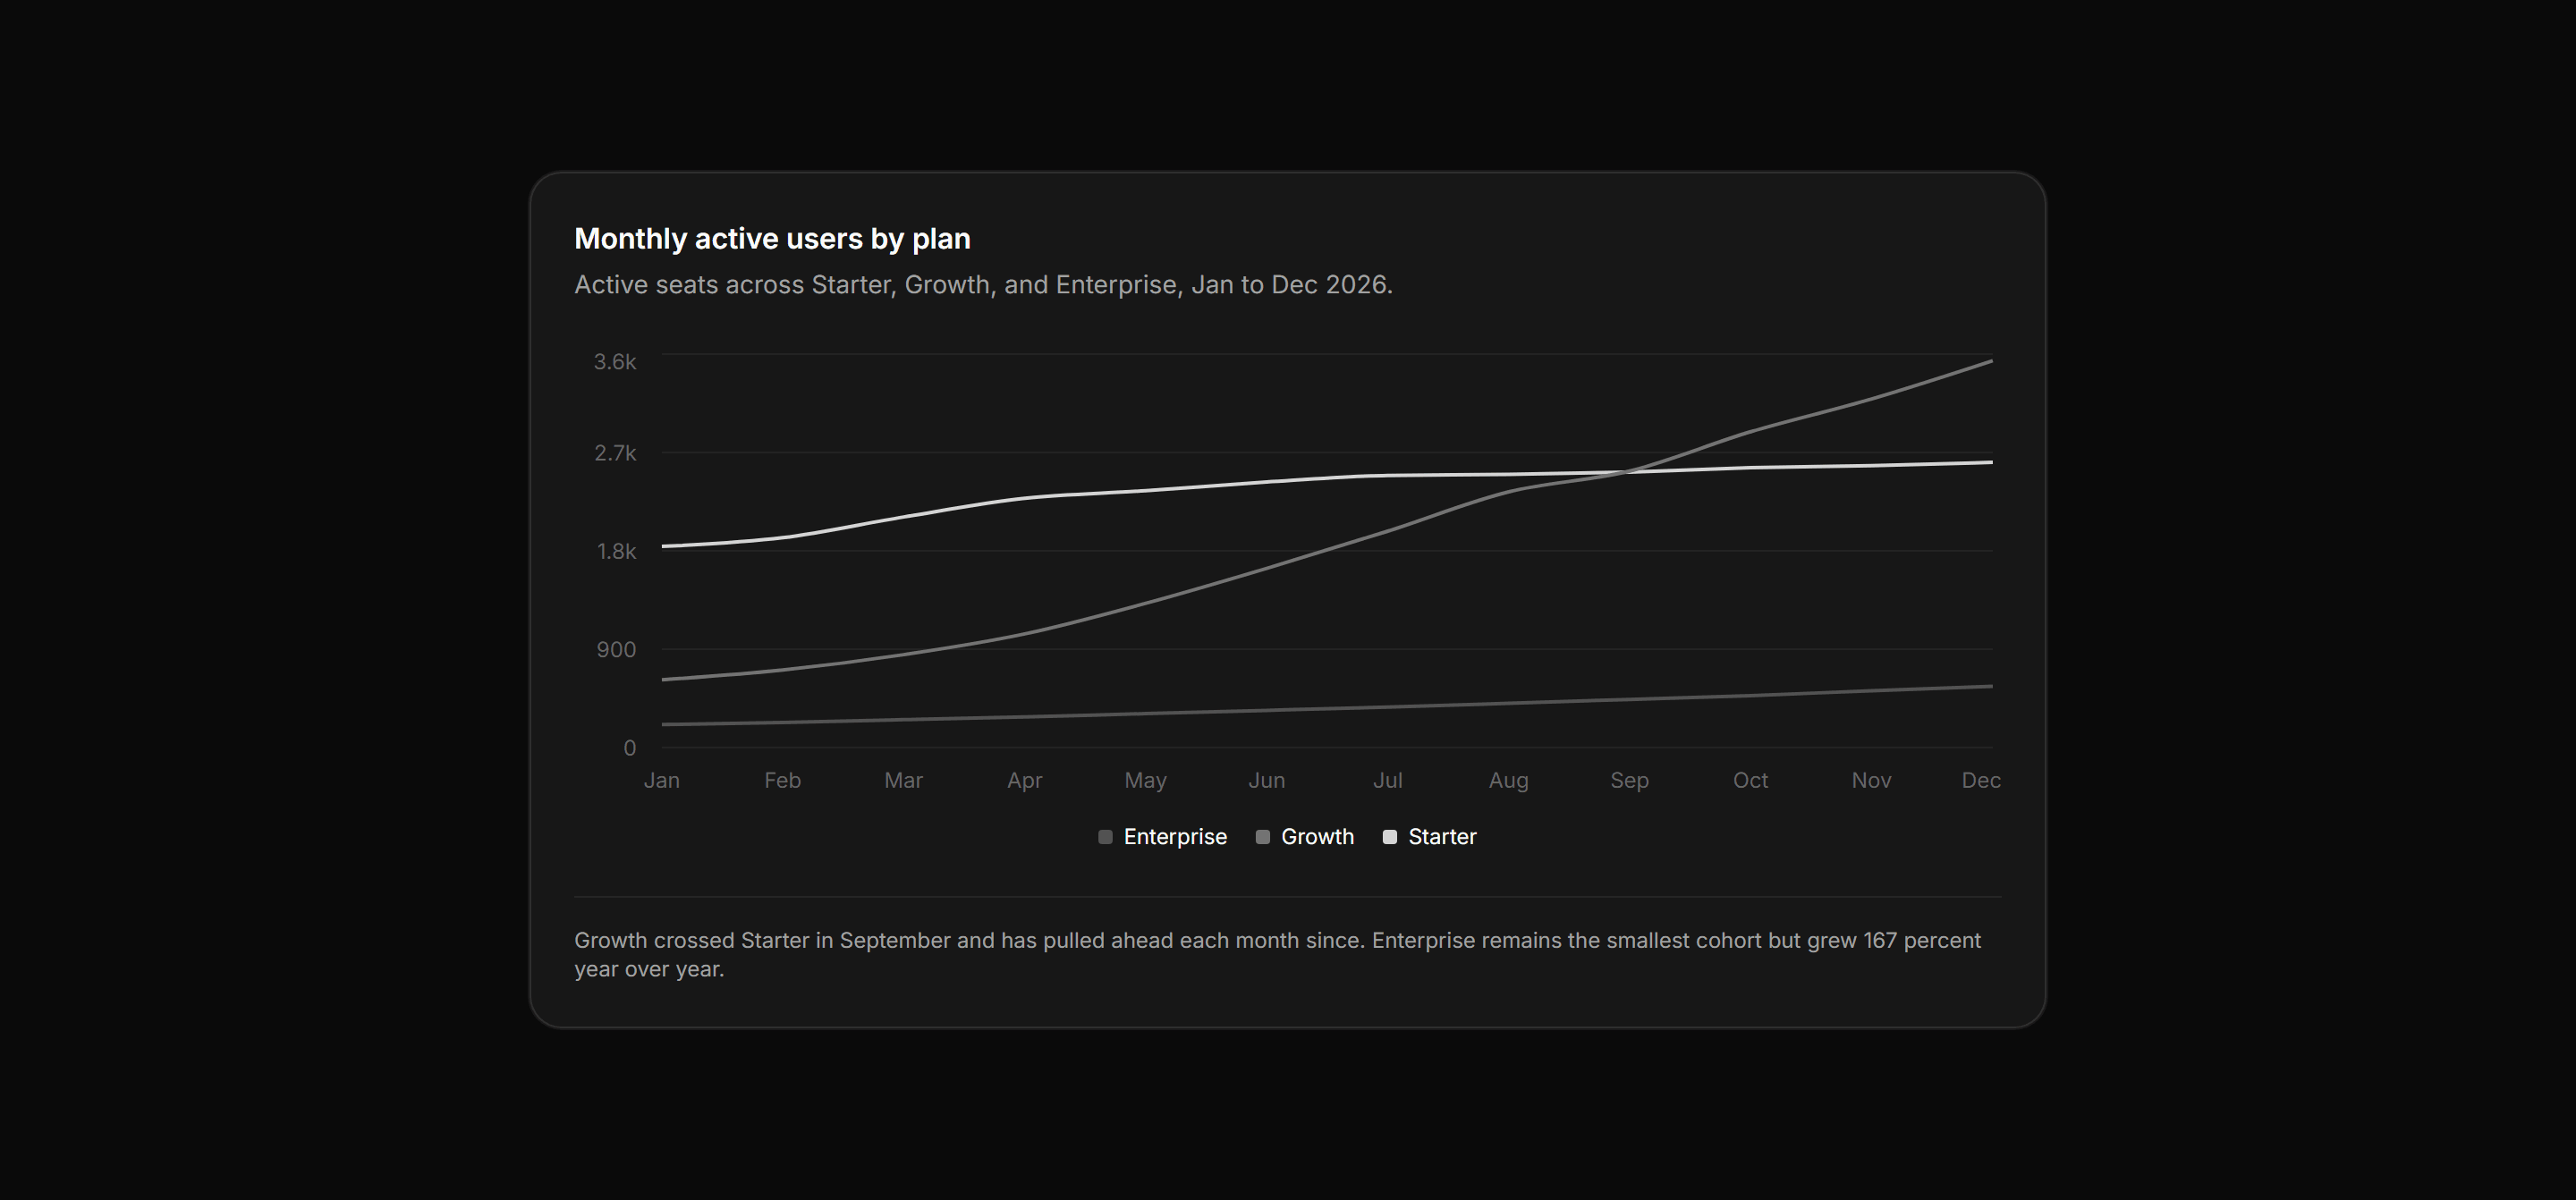
Application Chart: Multi Line Trend
Three-series line chart tracking monthly active seats across Starter, Growth, and Enterprise plans with a legend and a footnote naming the September crossover.
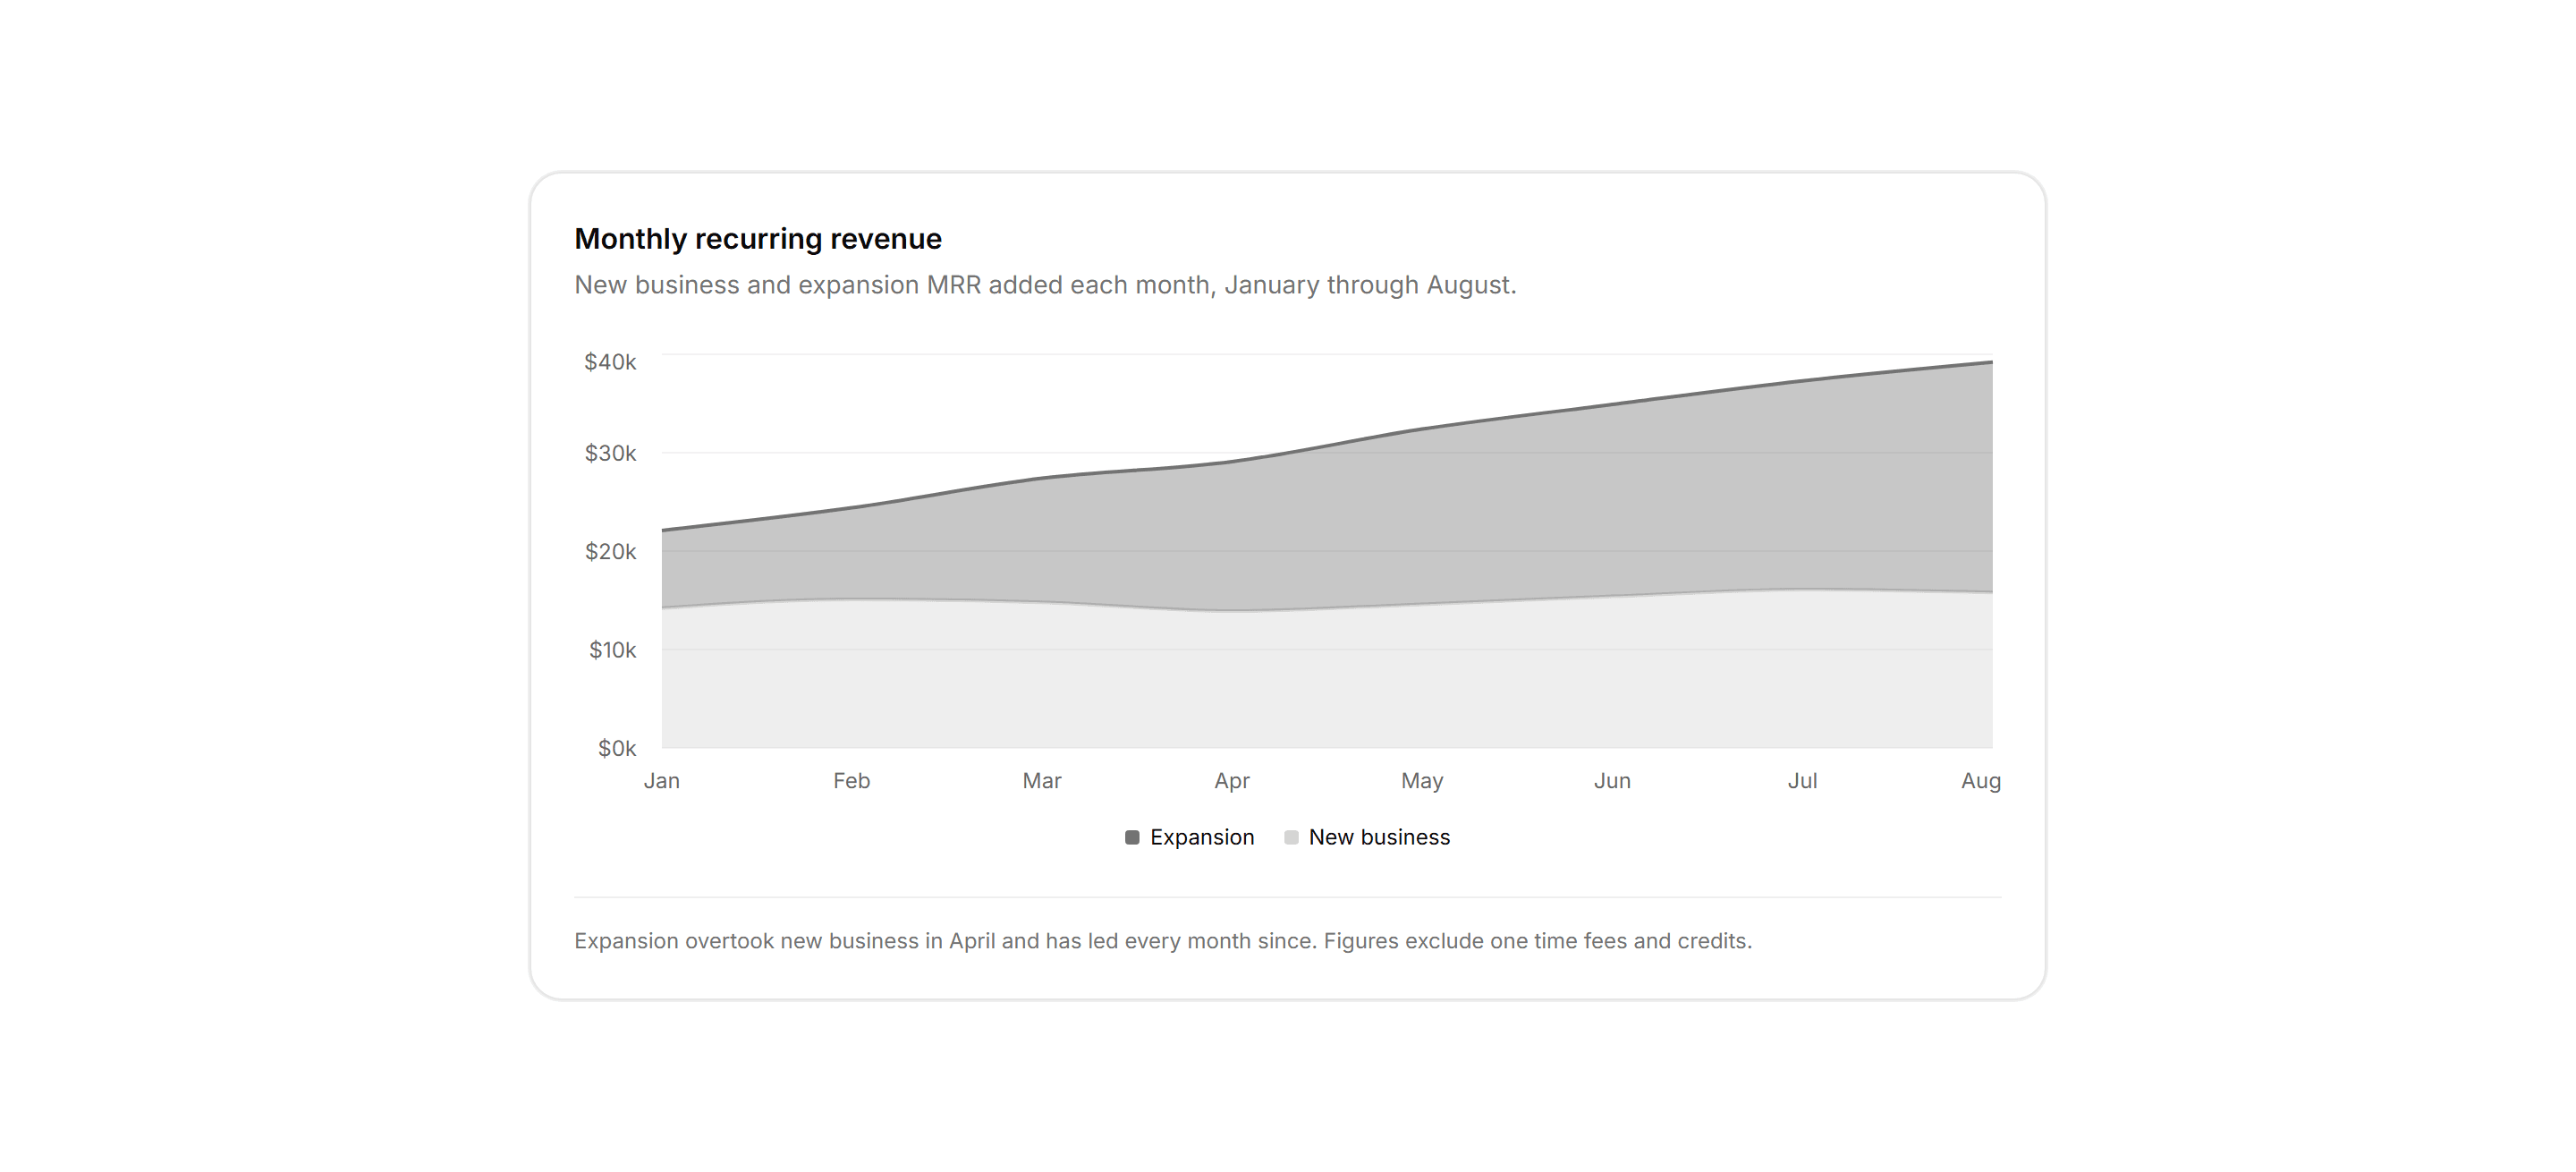

Application Chart: Revenue Area Chart
Stacked area chart showing new business and expansion MRR added each month across an 8 month window.
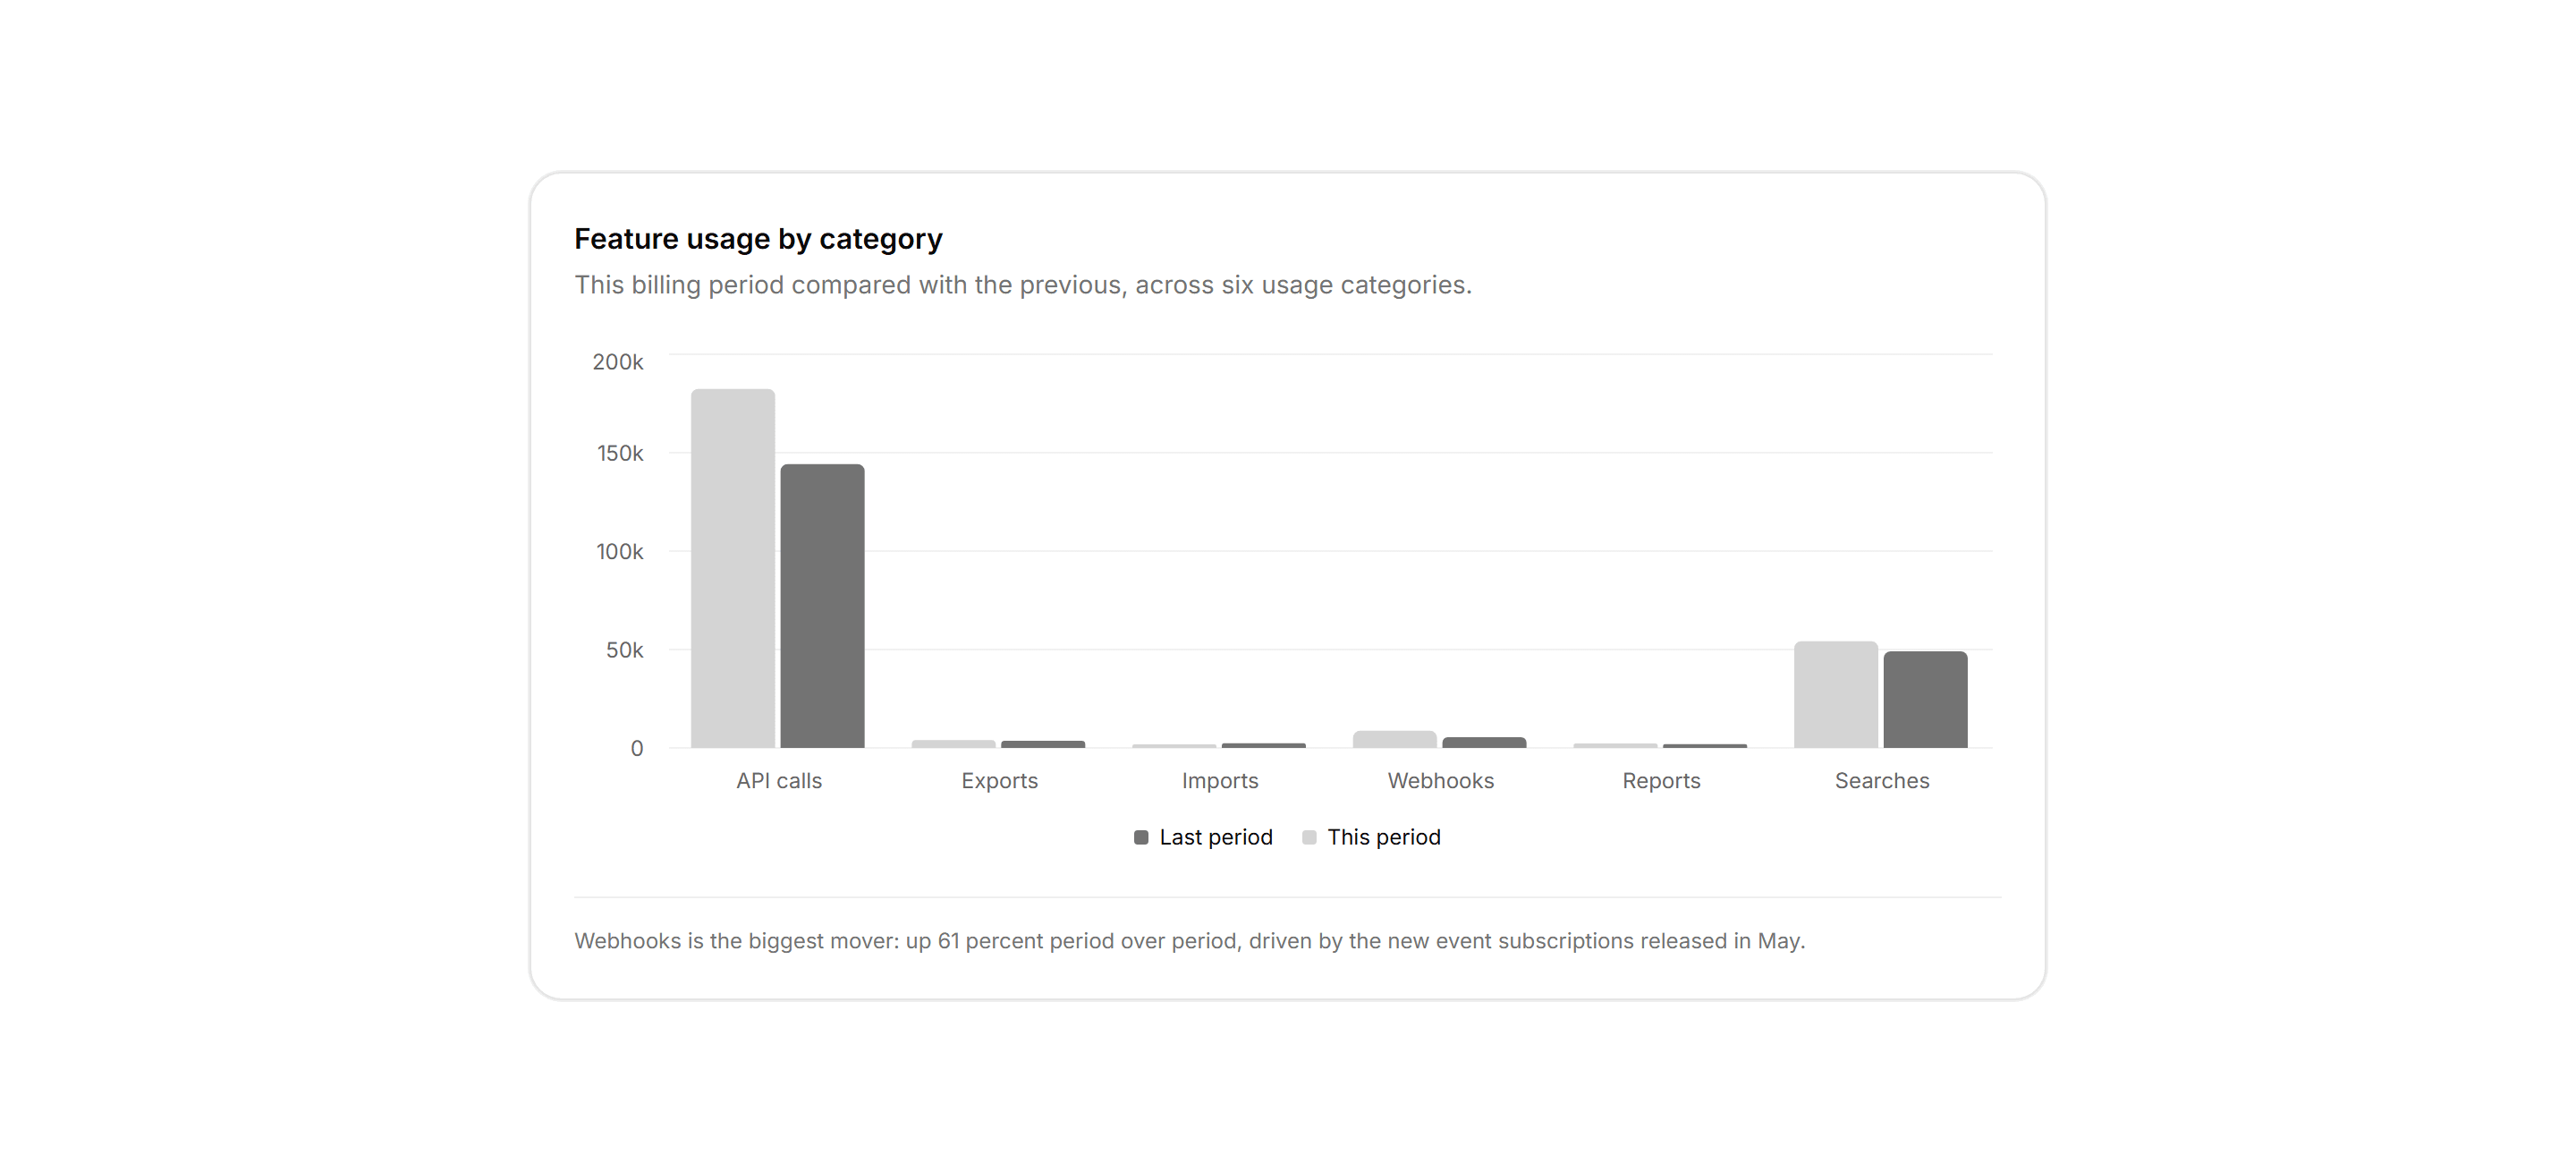
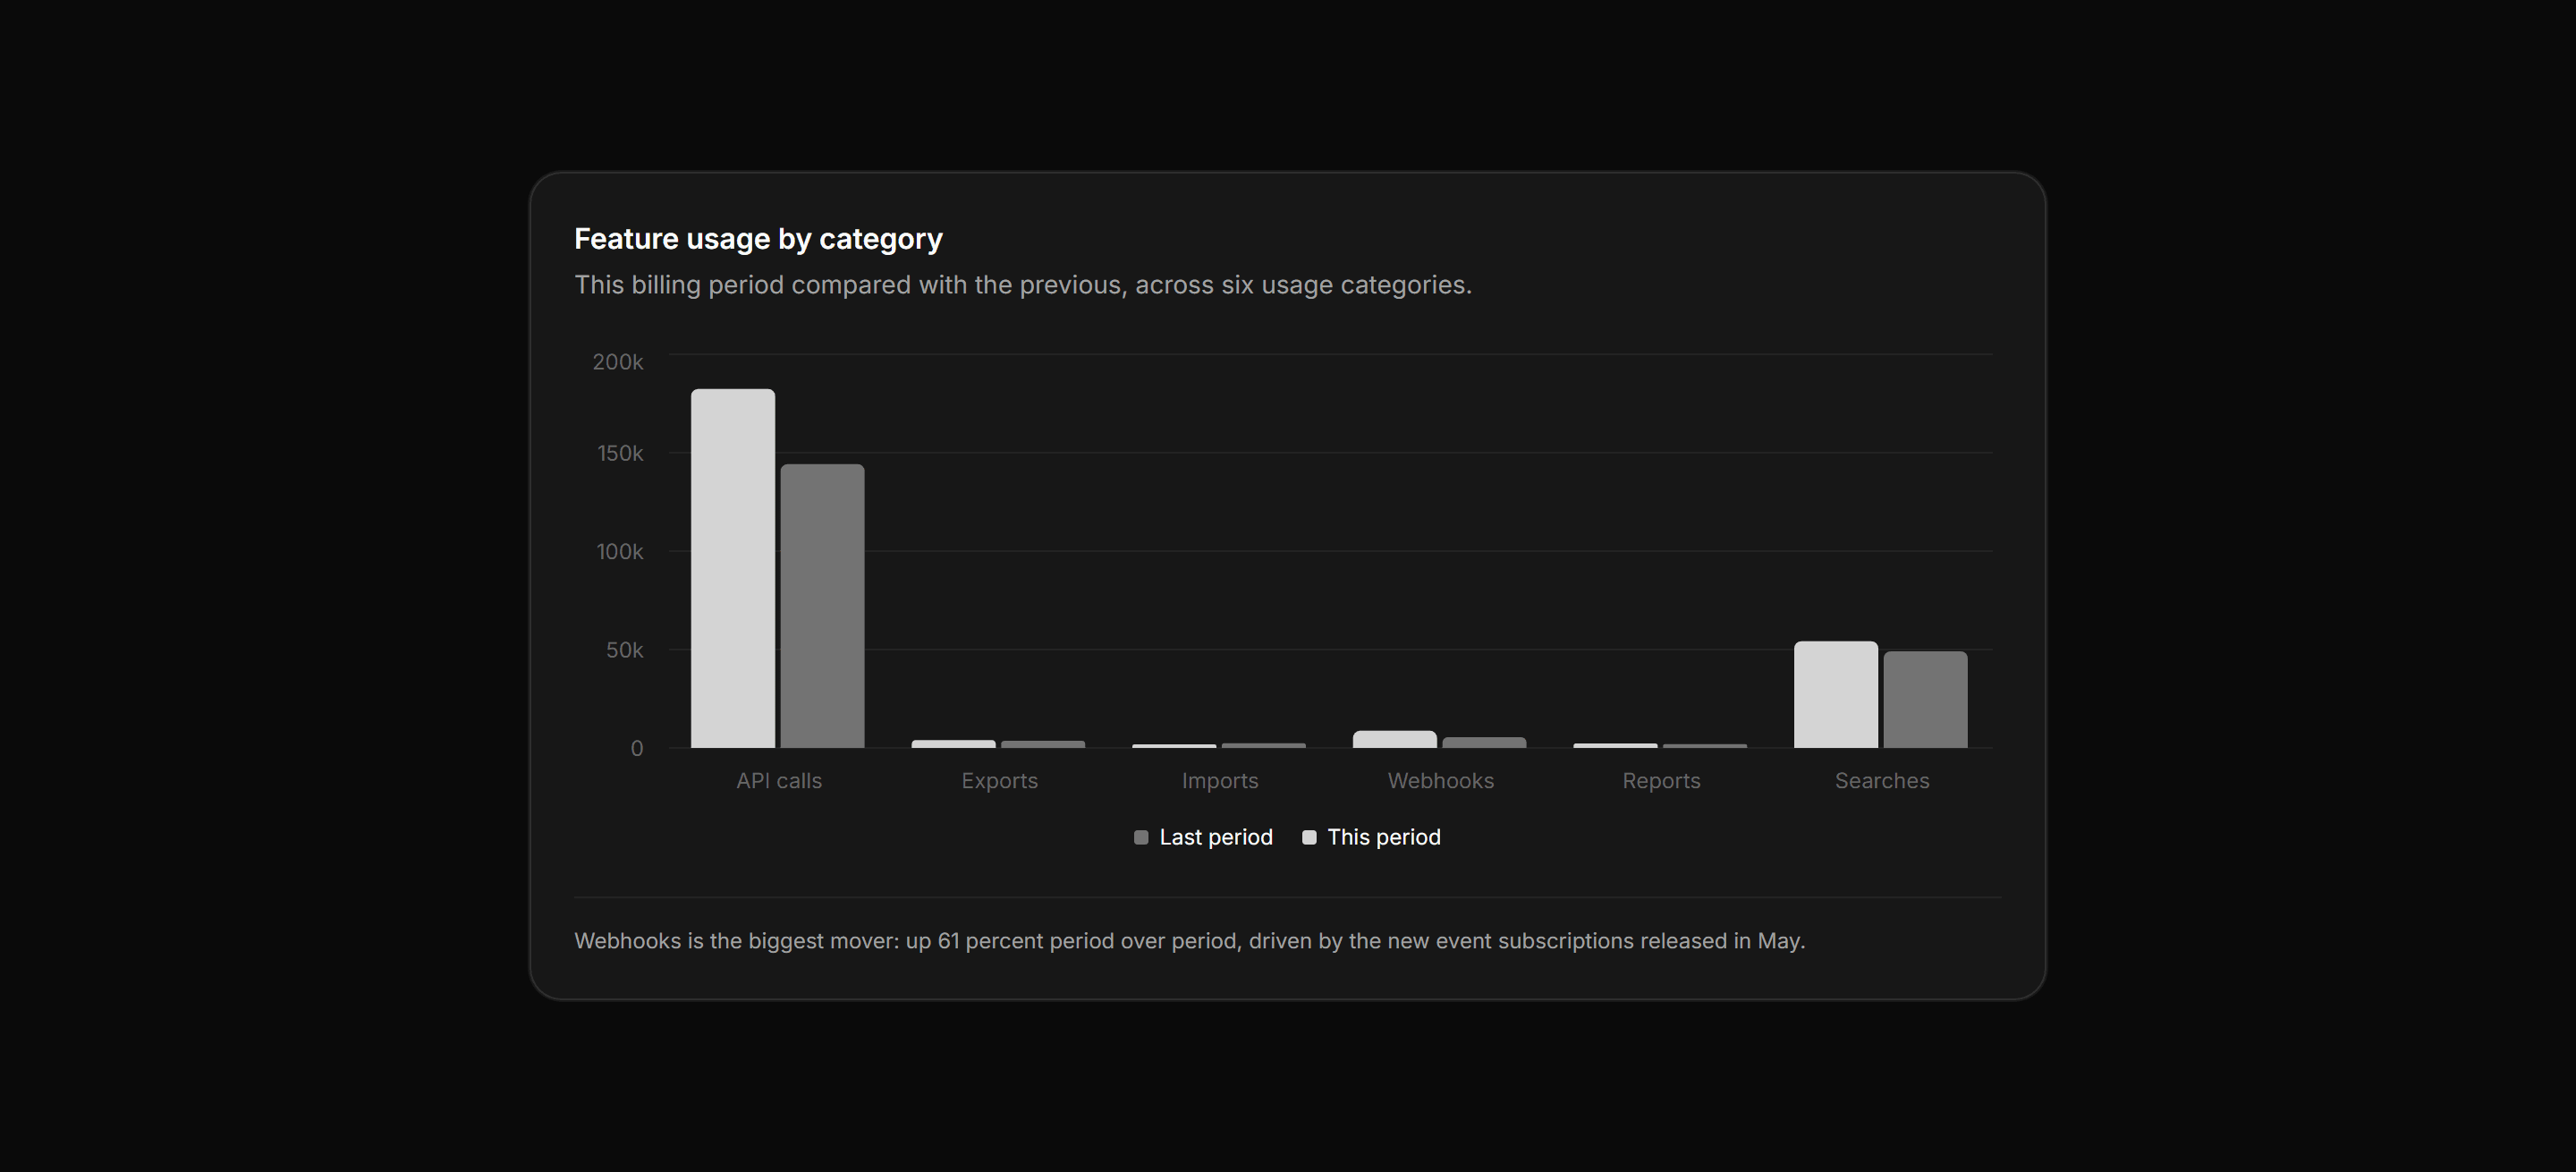
Application Chart: Grouped Bar Chart
Feature usage grouped bar chart comparing this billing period against the previous across six categories with a shared legend.
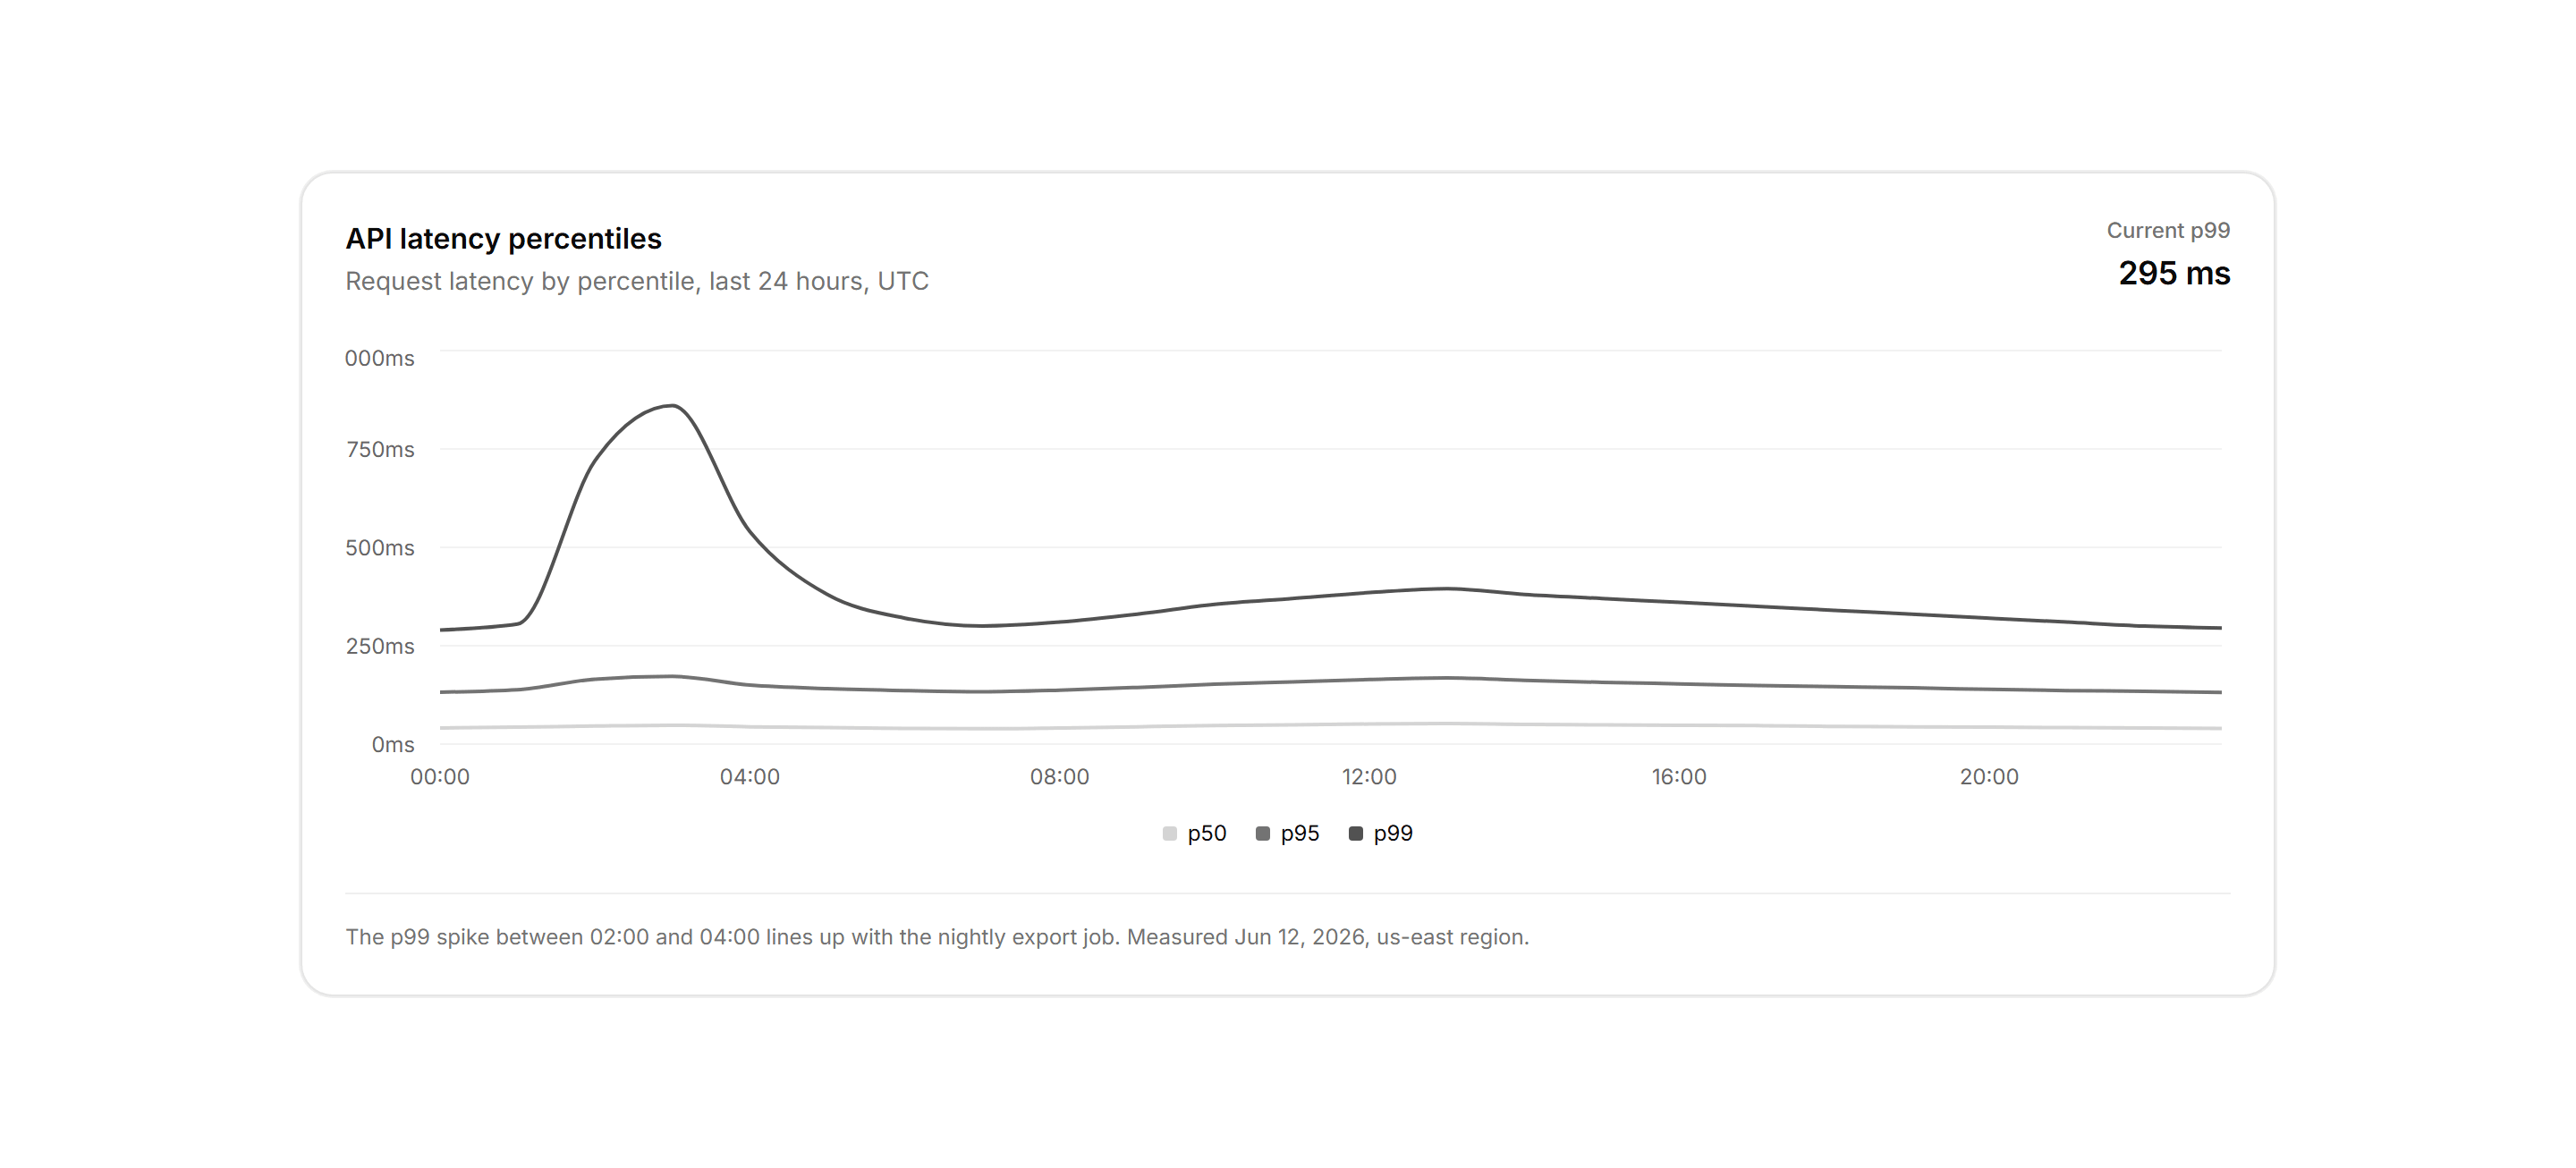

Application Chart: Latency Percentile Chart
API request latency as p50, p95, and p99 lines over 24 hourly points with ms axis formatting.
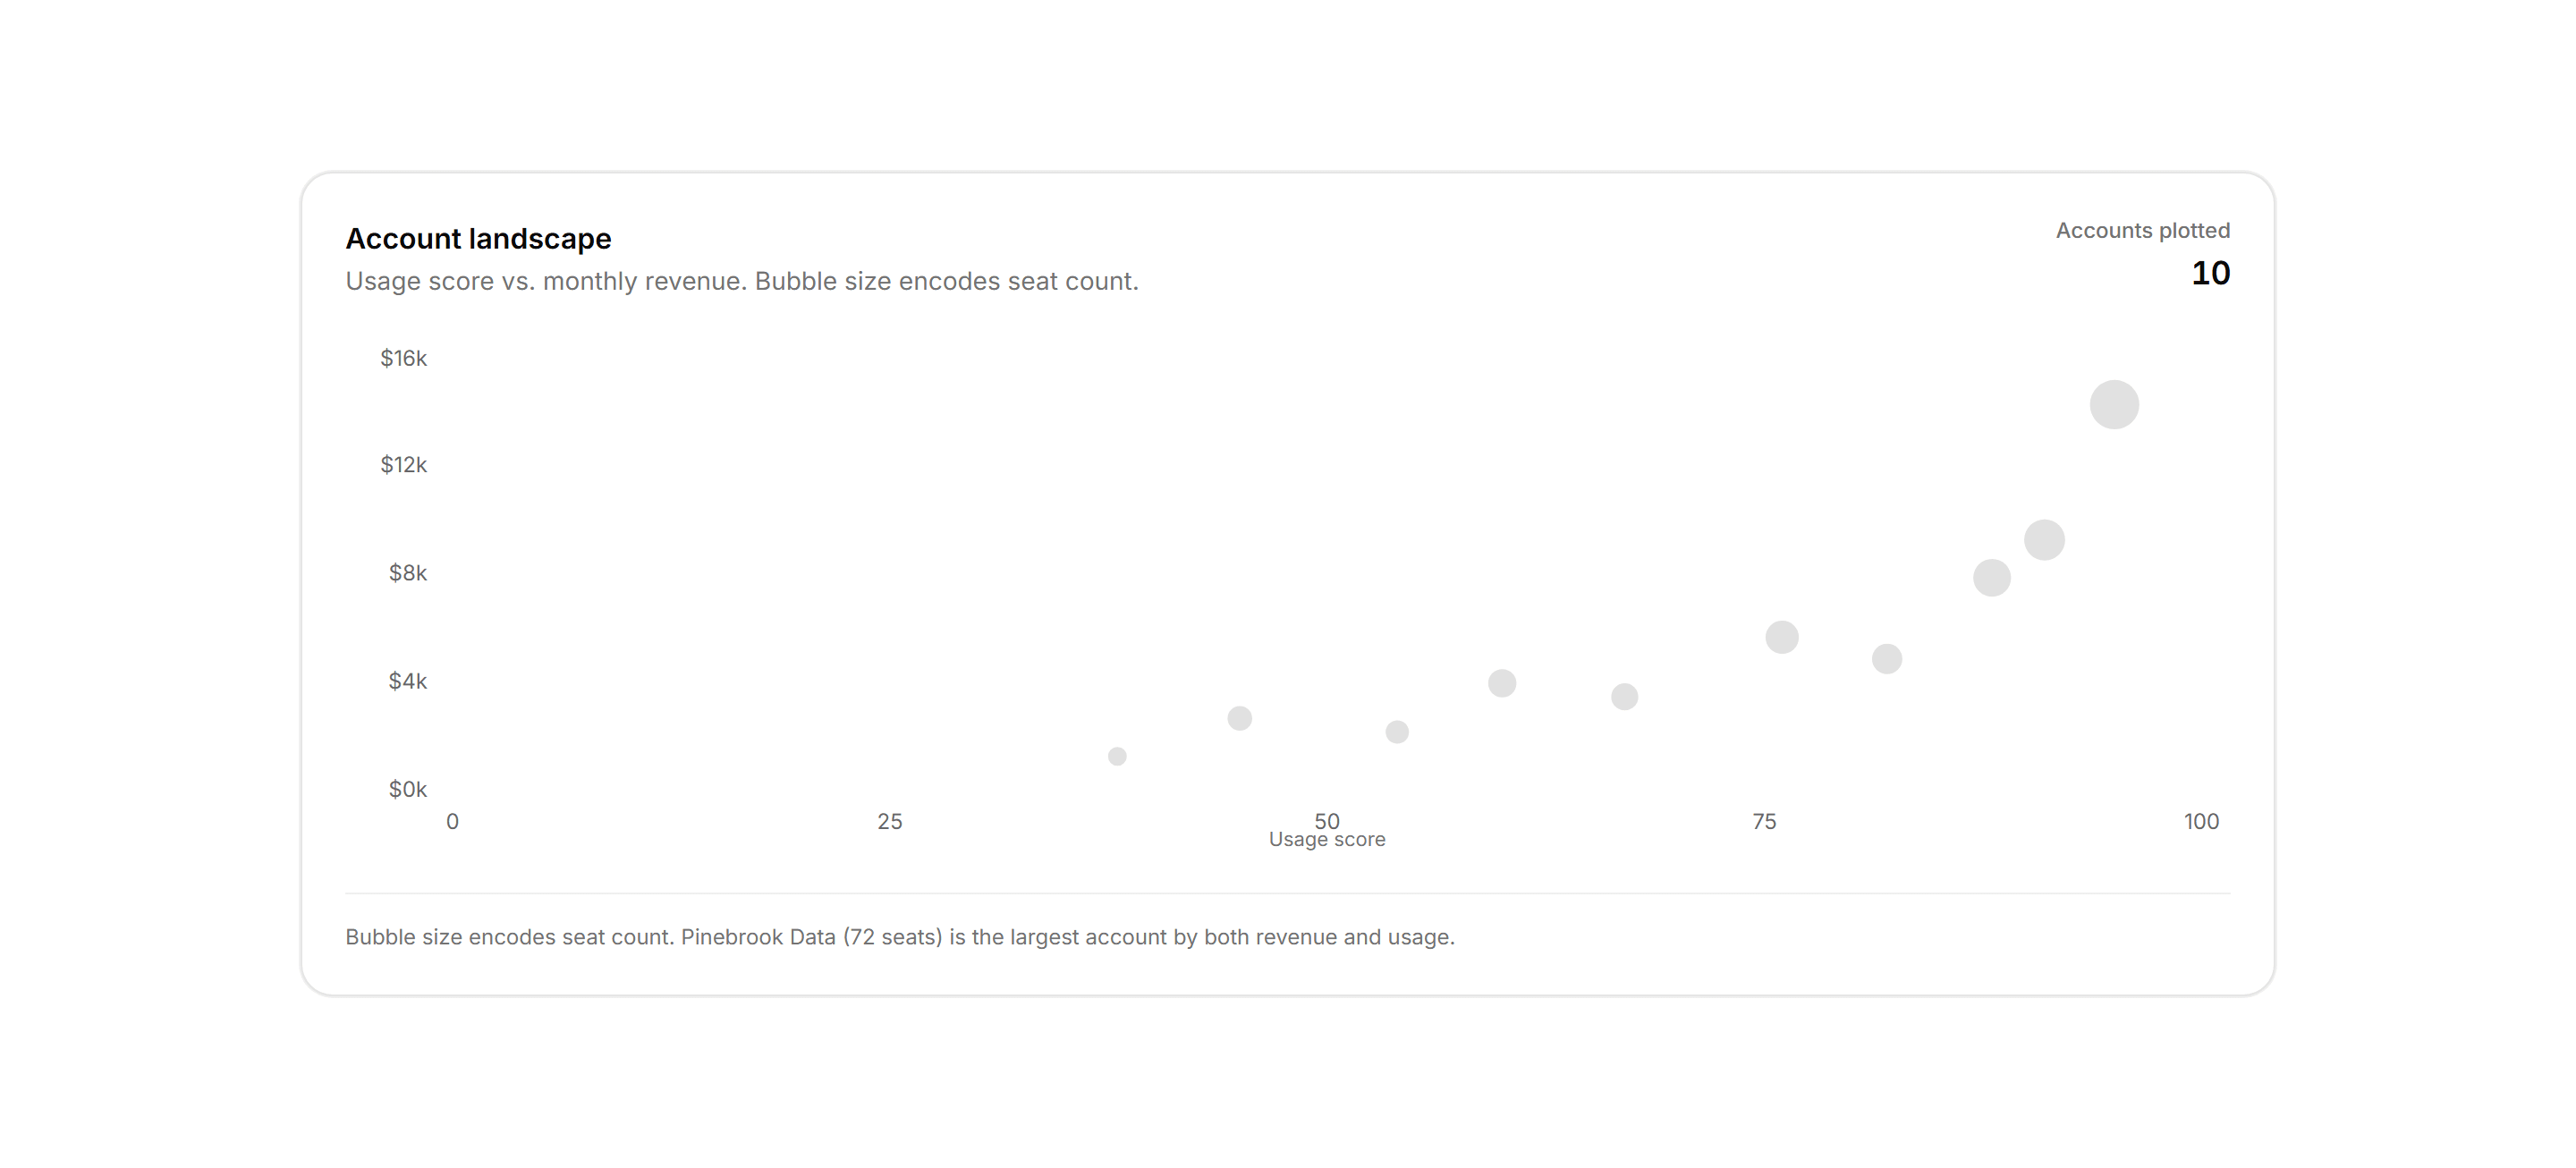
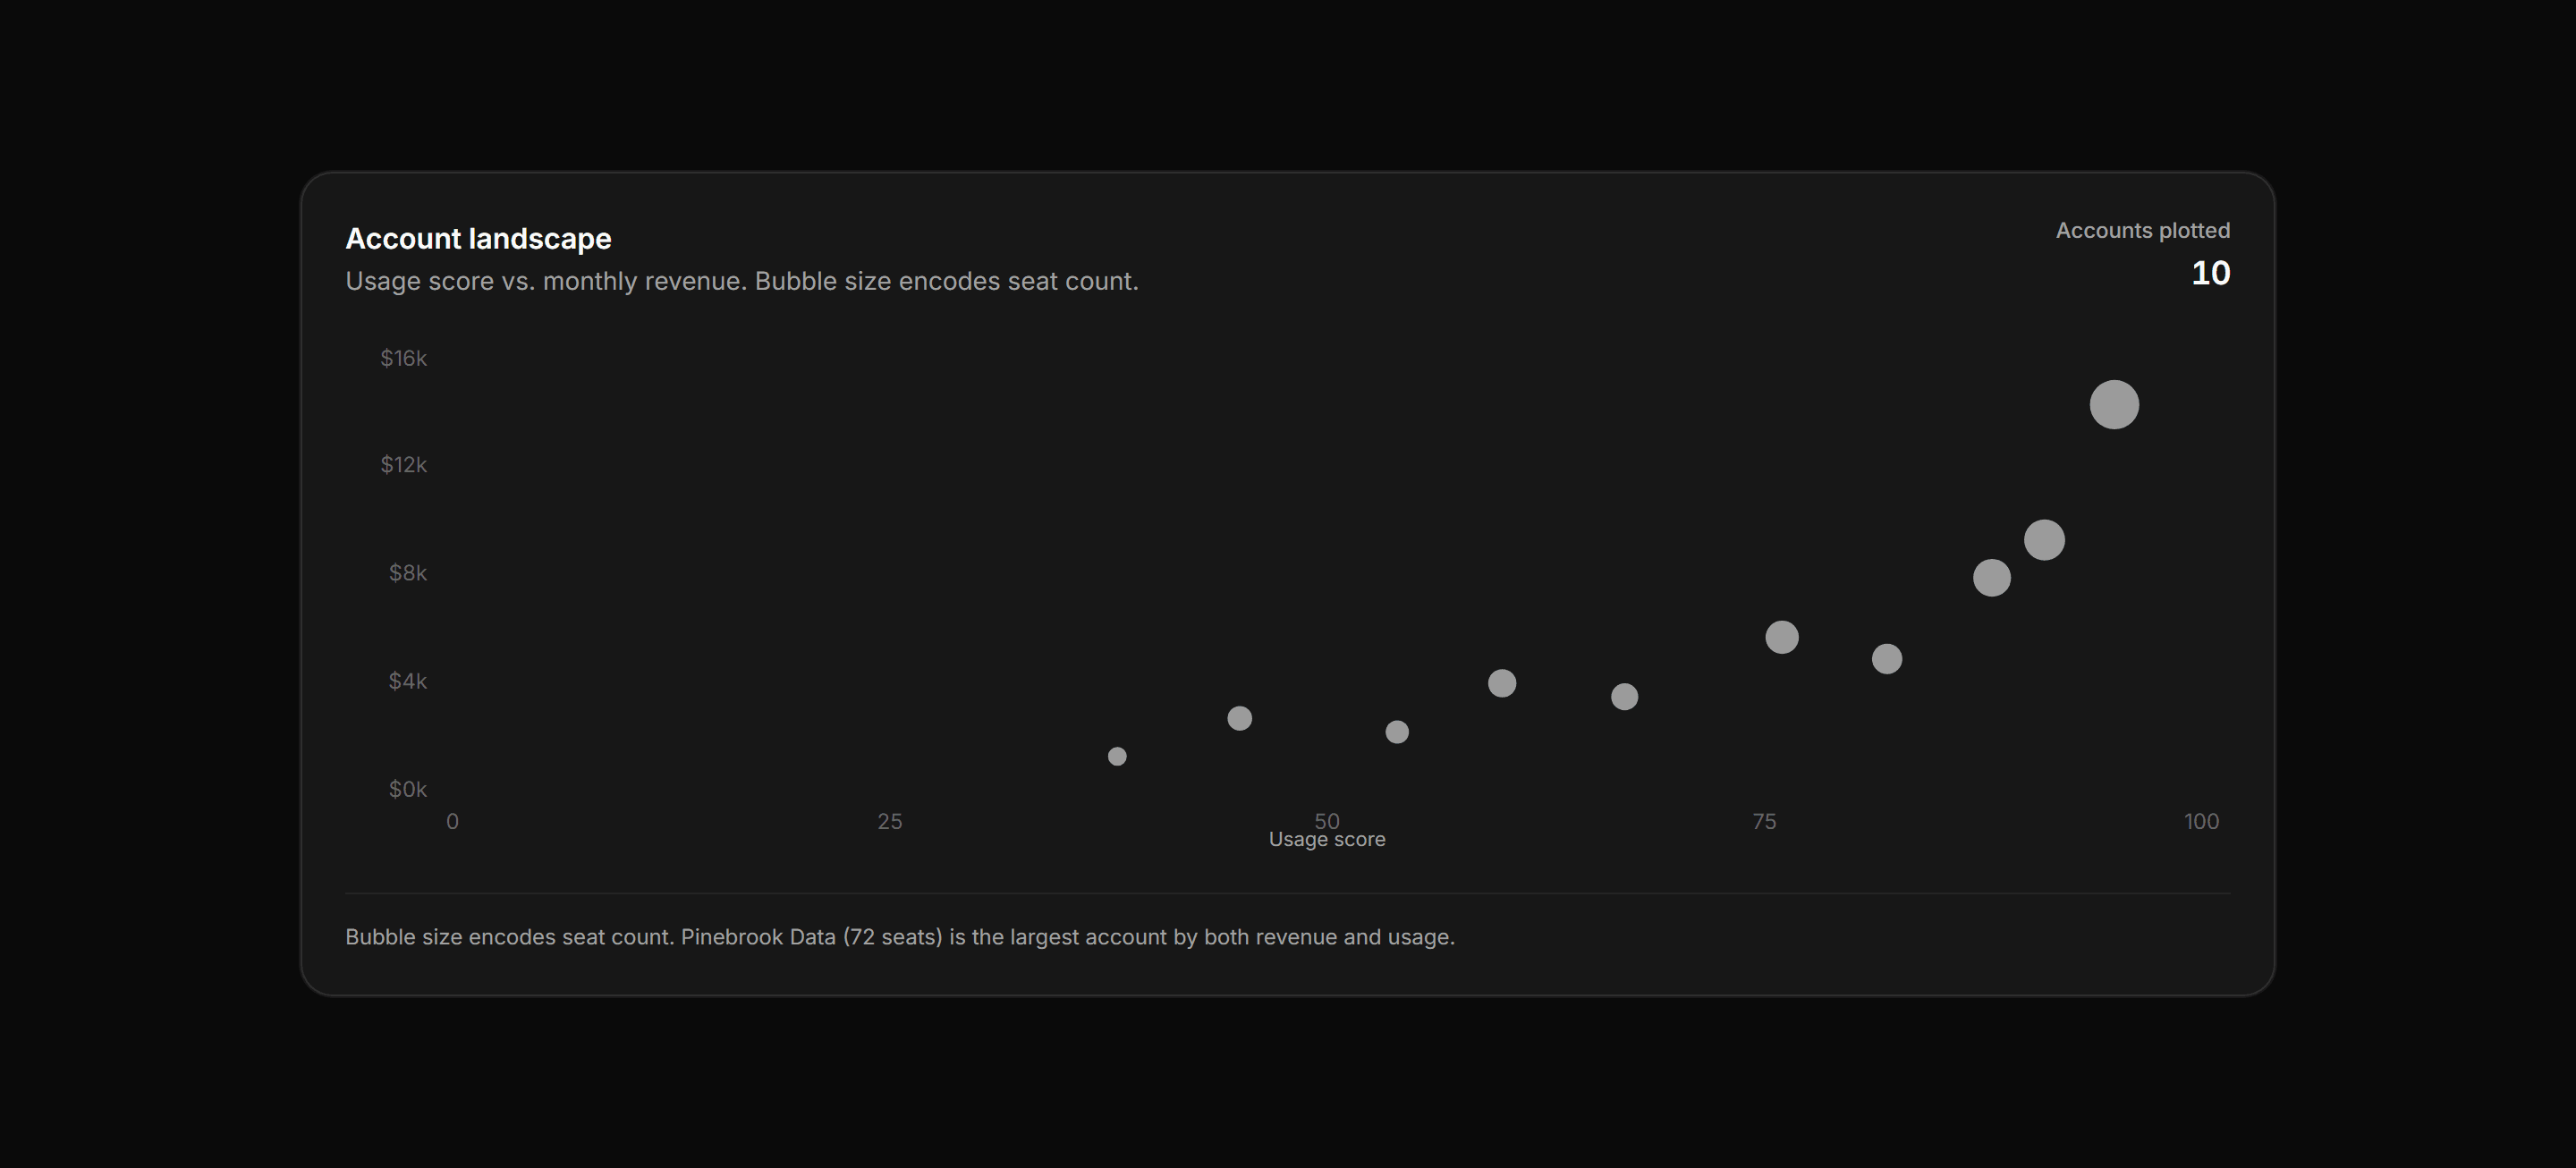
Application Chart: Bubble Chart
ScatterChart plotting accounts by usage score, monthly revenue, and seat count encoded as bubble size.


Application Chart: Gauge Progress Chart
A radial gauge showing a single SLA percentage with the value centred and the target threshold named in the footnote.
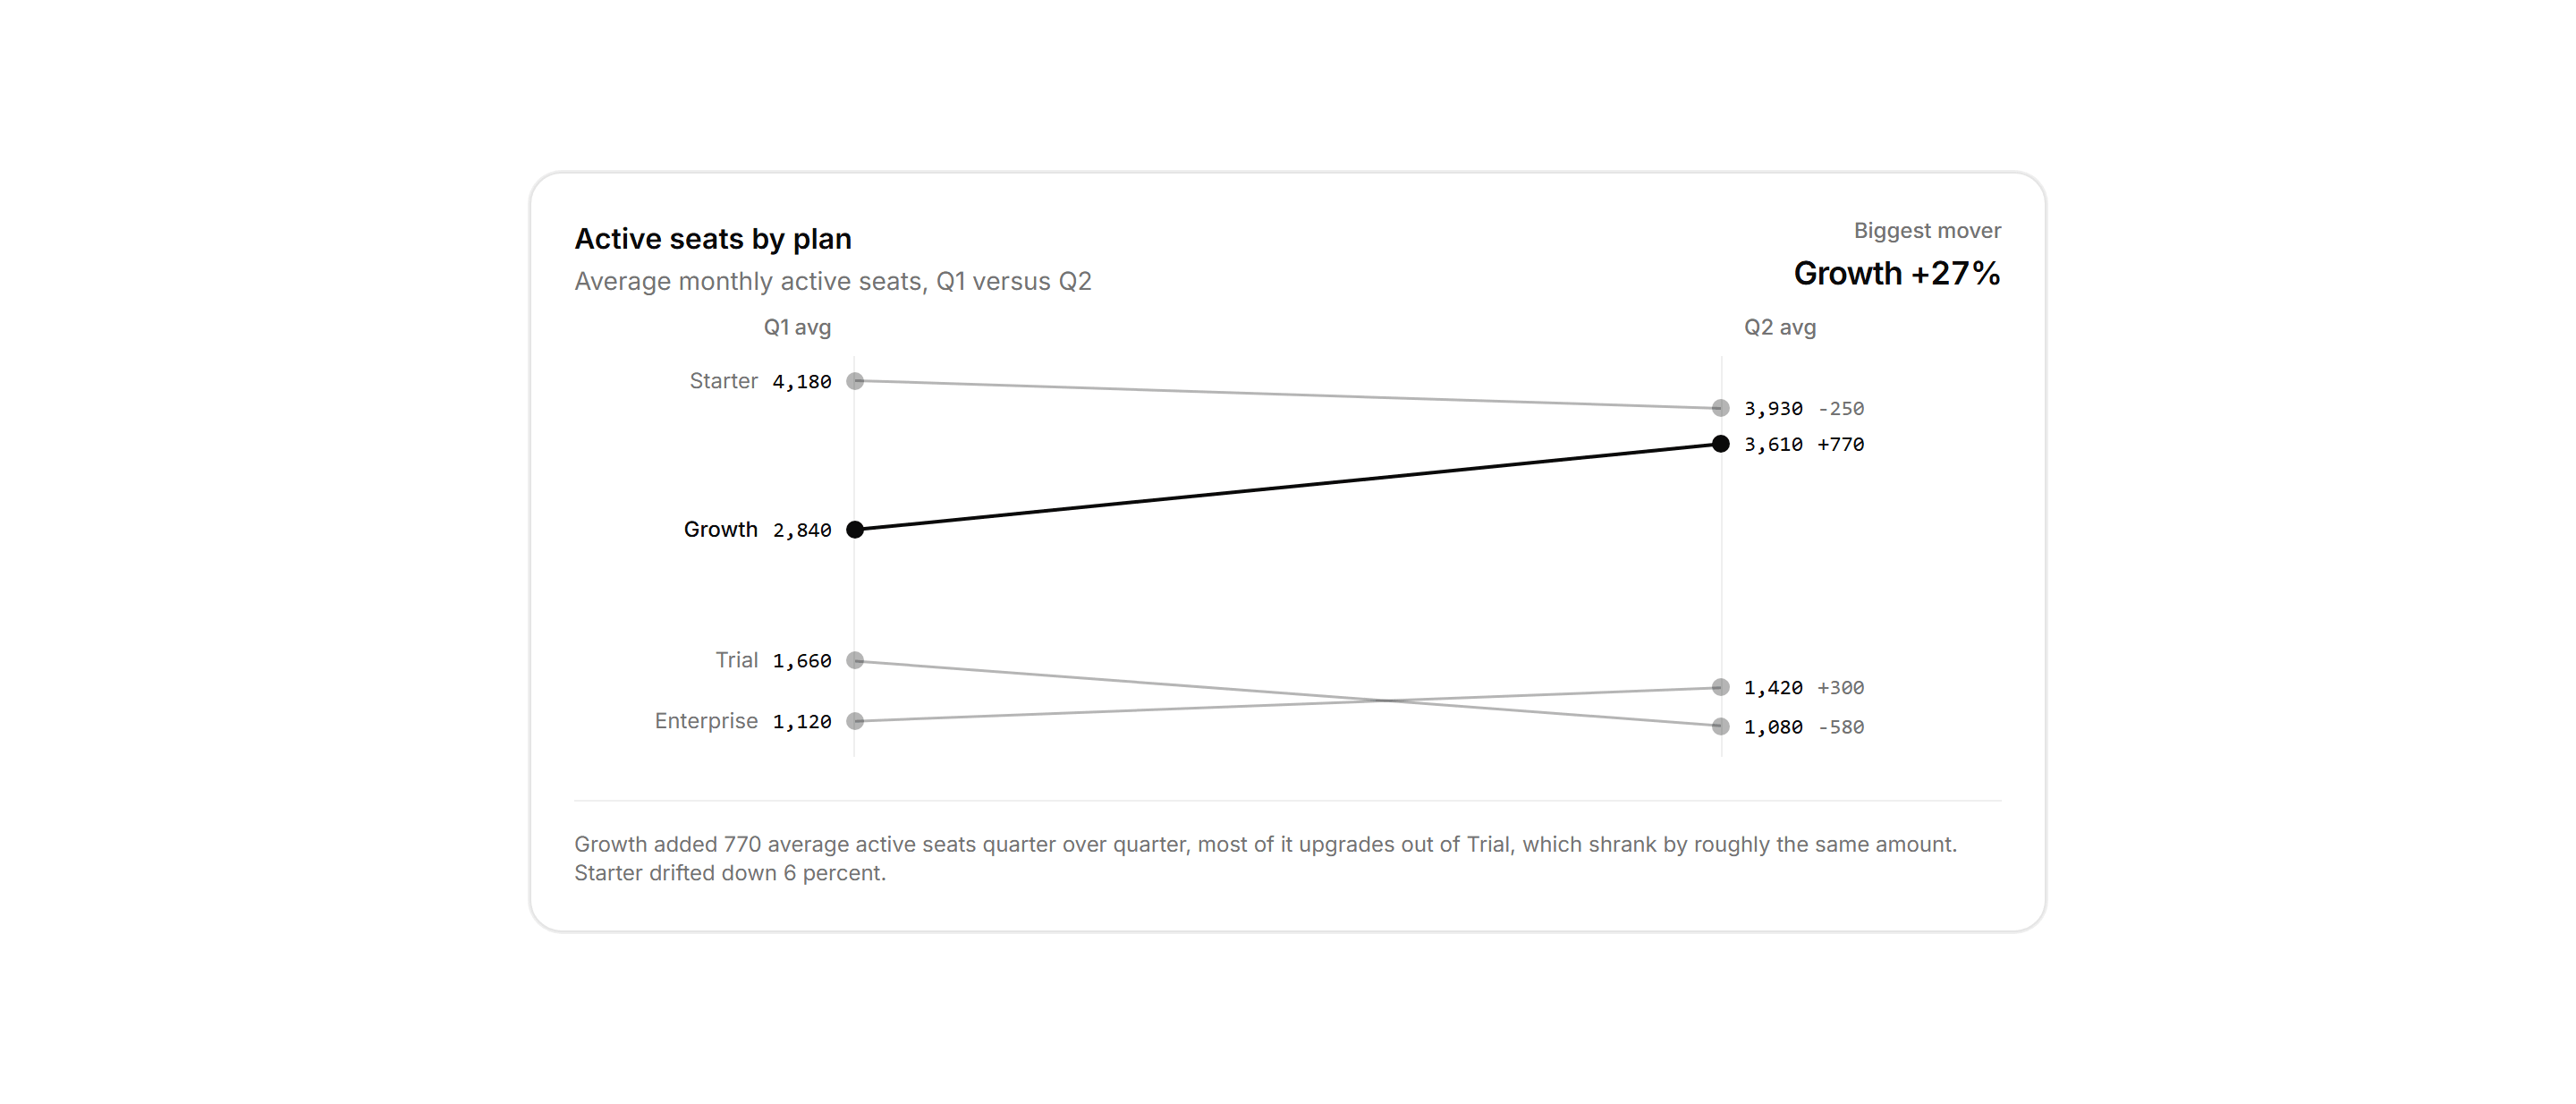

Application Chart: Slope Comparison Chart
A card panel joining average active seats per plan across two quarters with slope lines between paired axes, the biggest mover drawn in full ink.
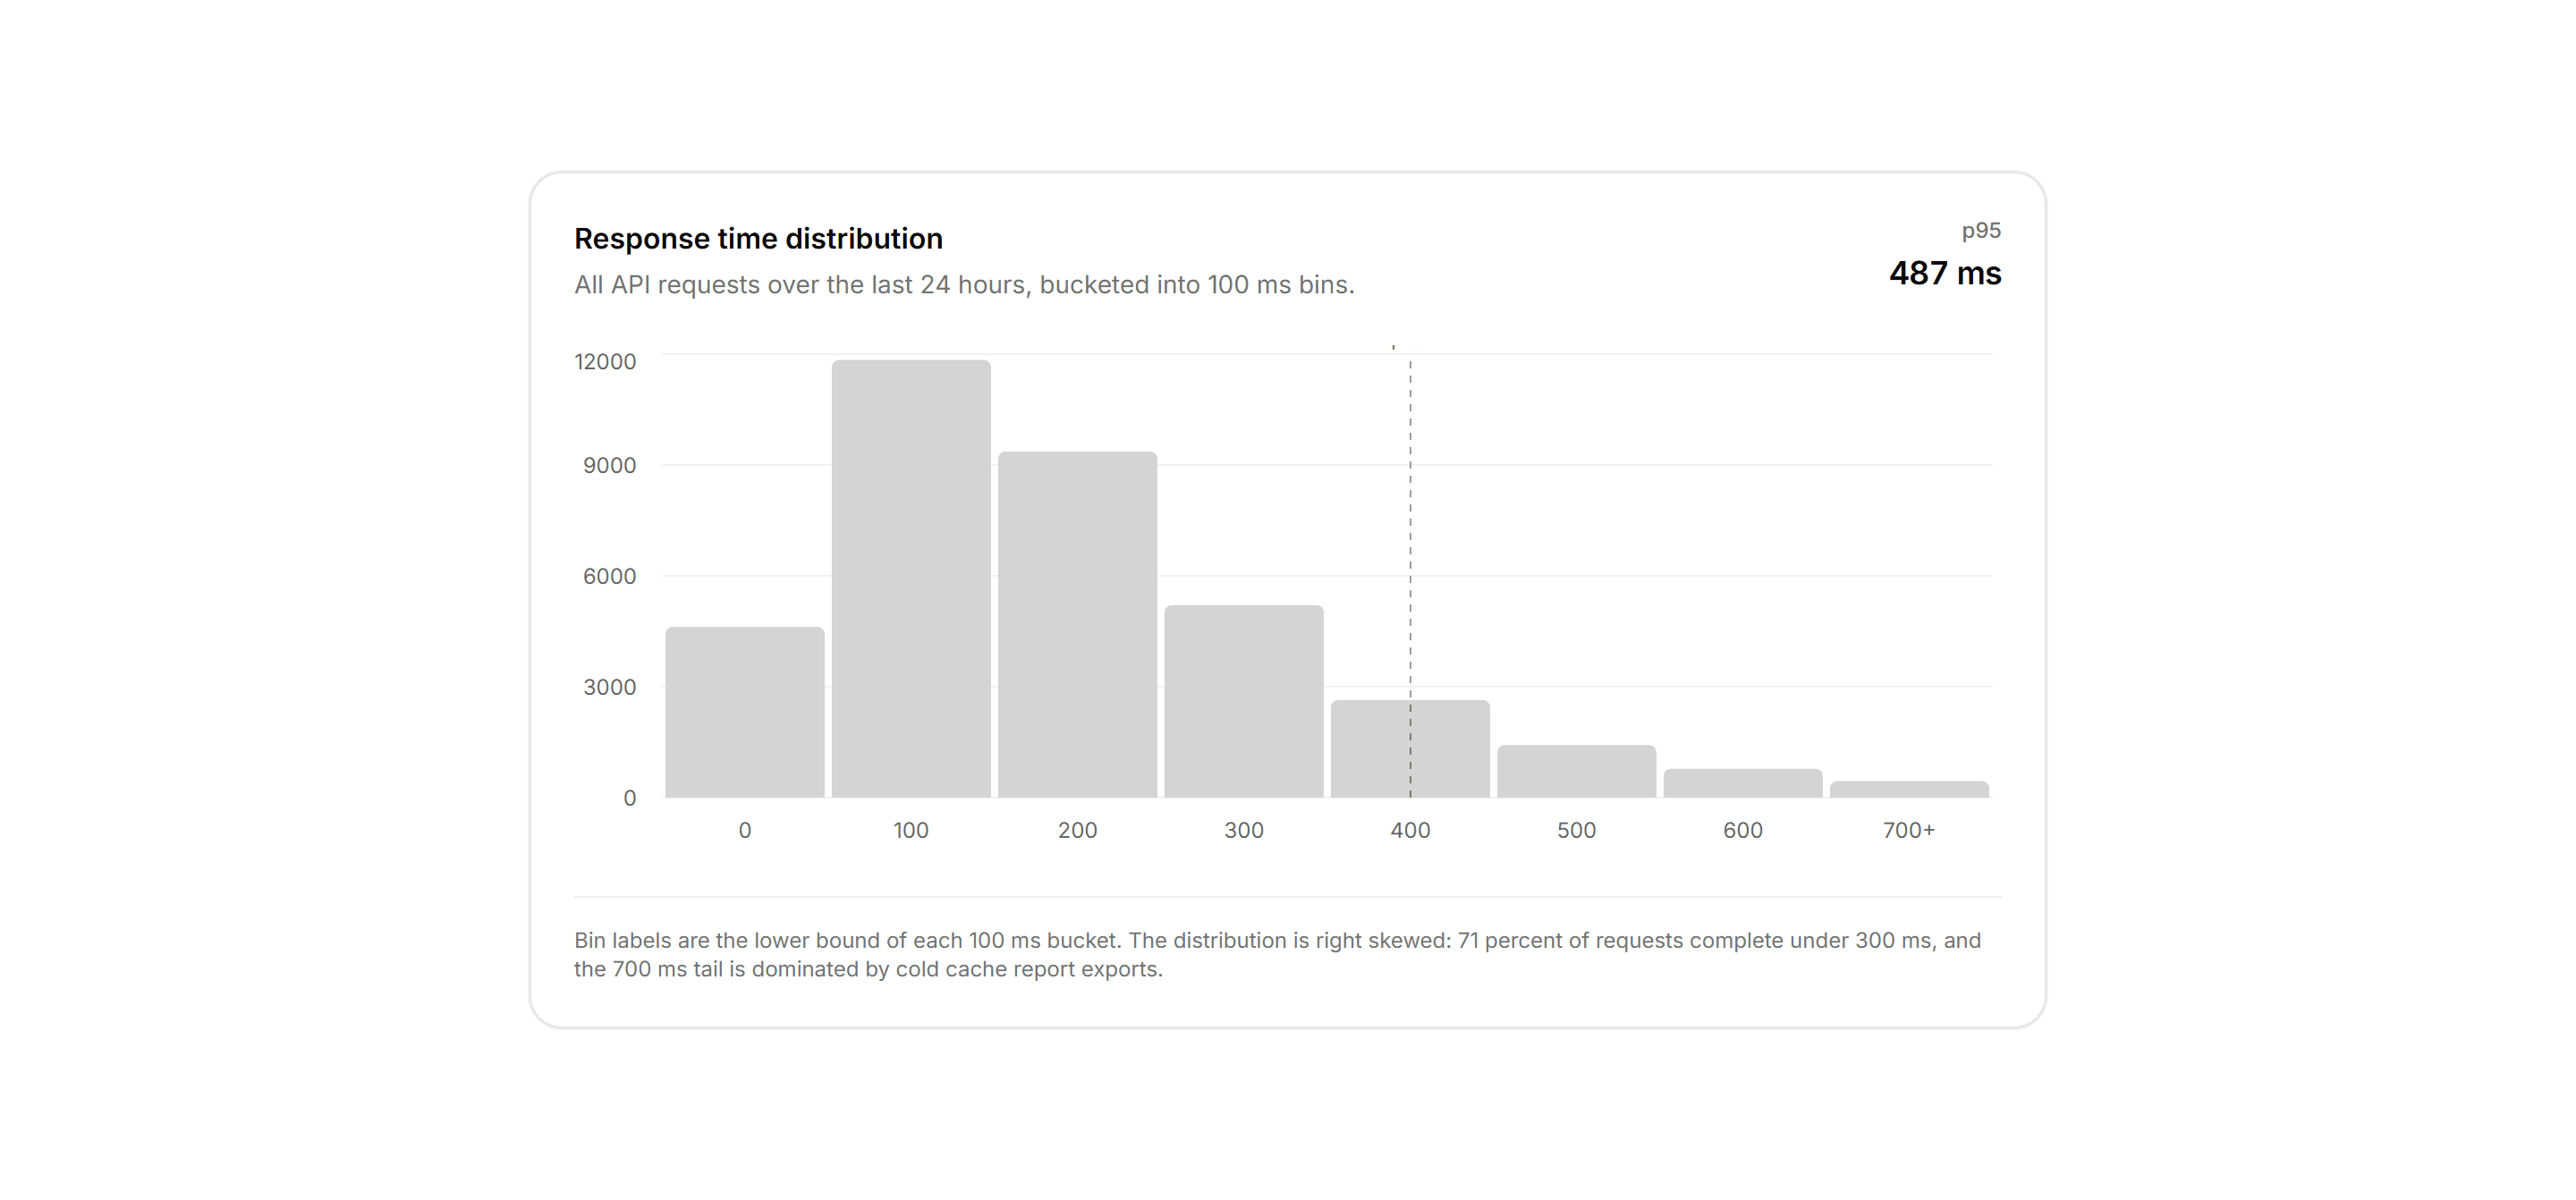
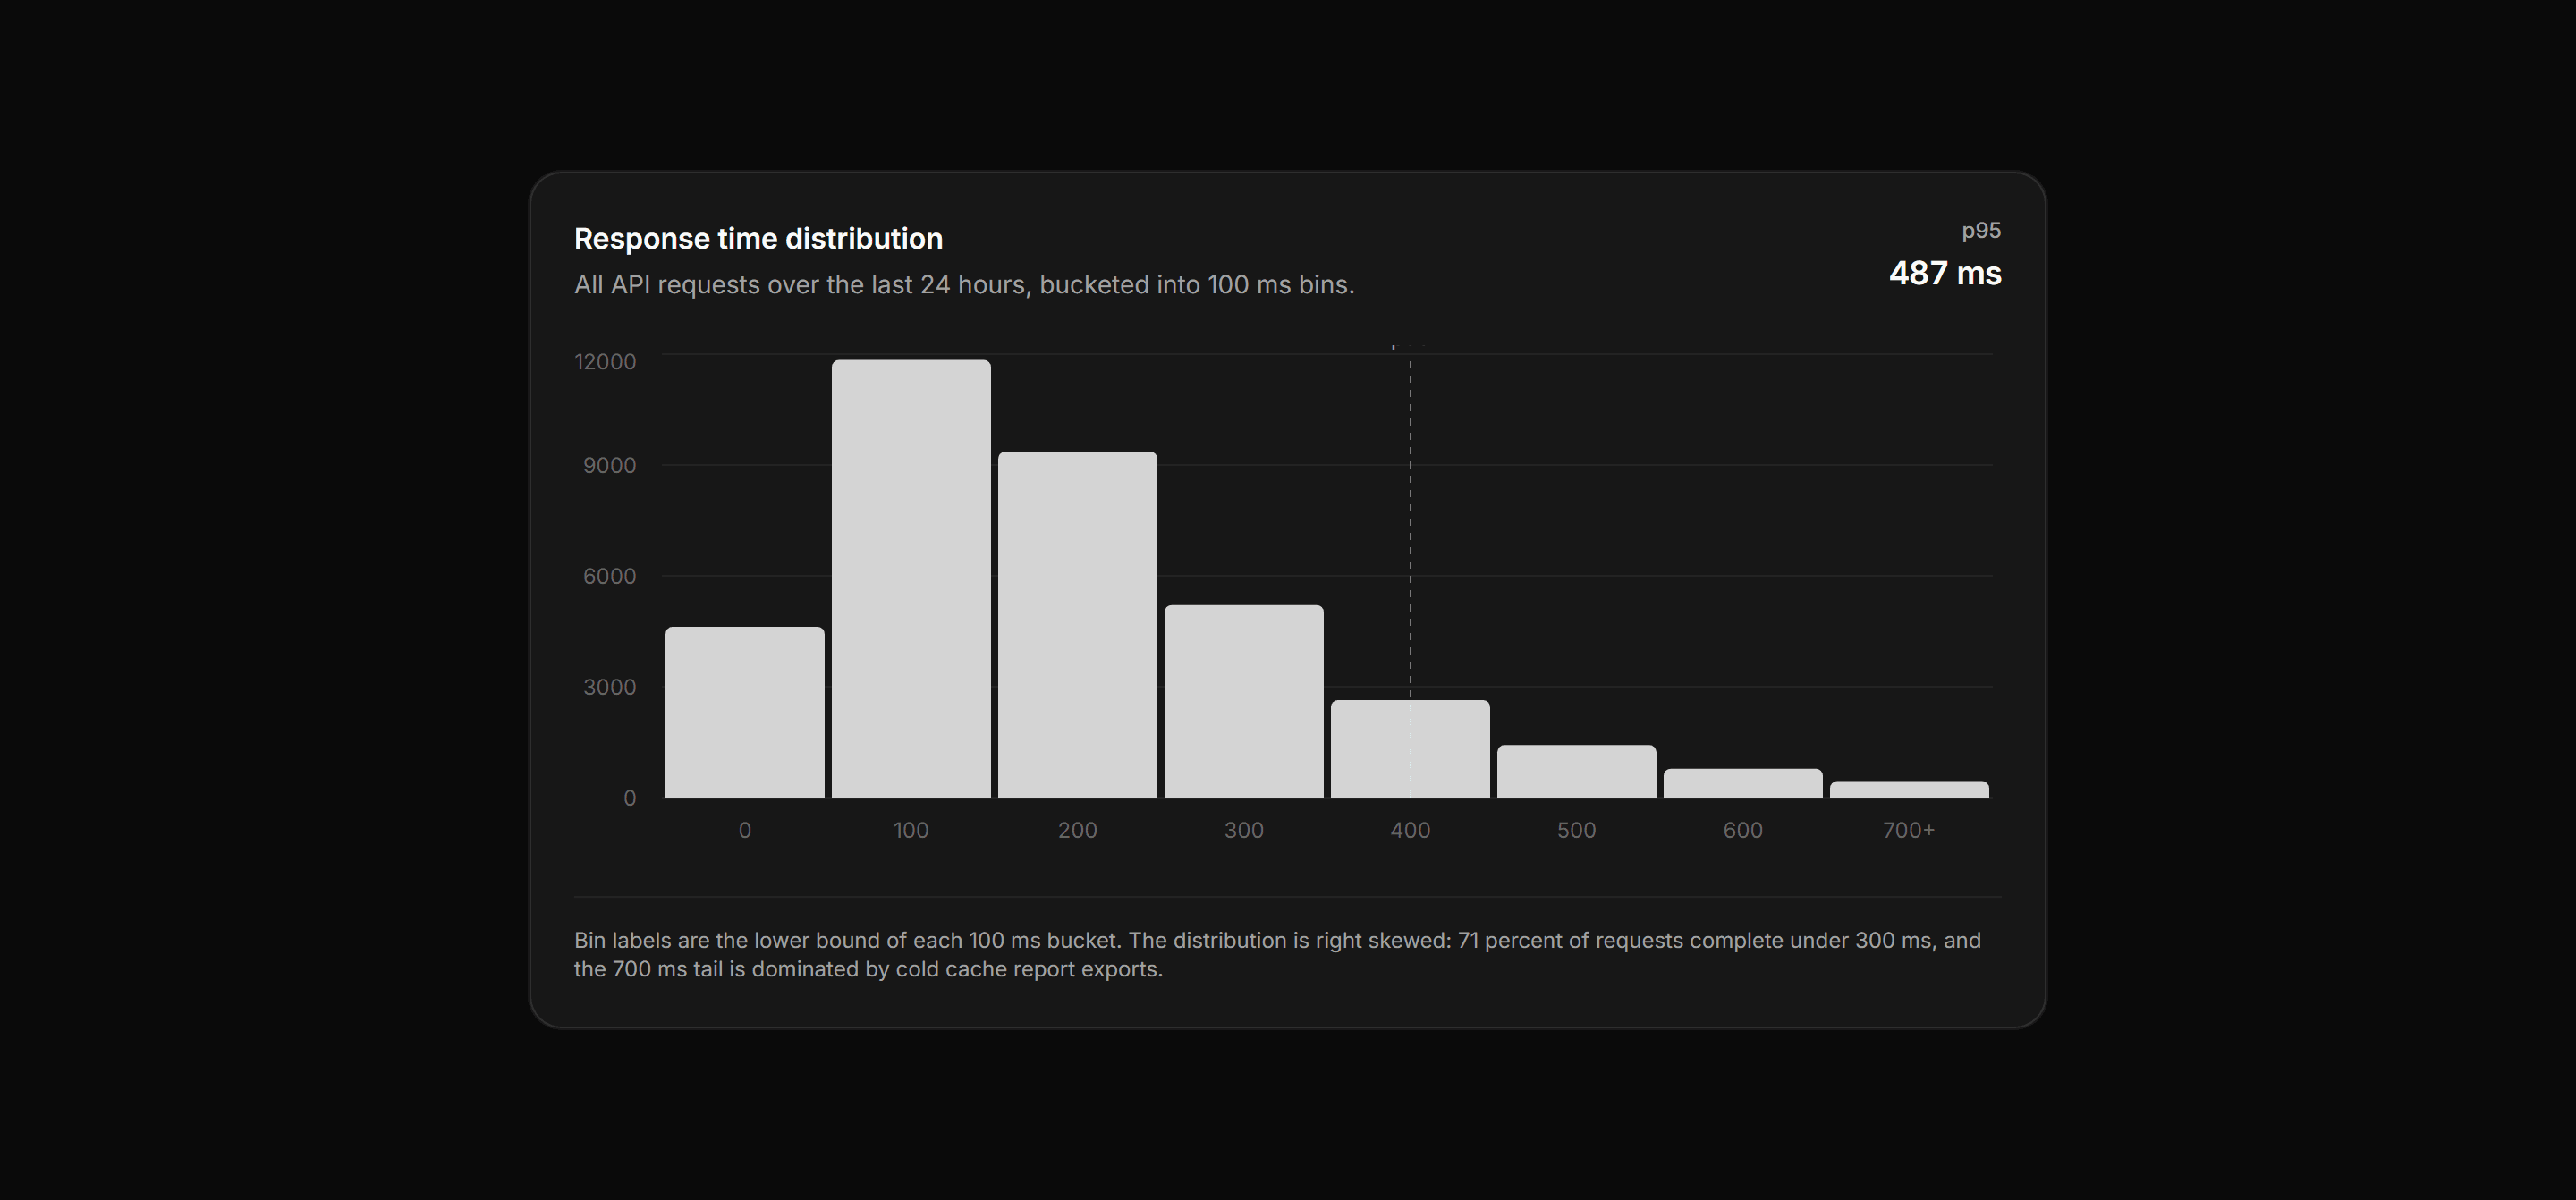
Application Chart: Histogram Distribution Chart
A card panel charting API response times bucketed into 100 ms bins as a single distribution, with a p95 callout and a dashed reference line.
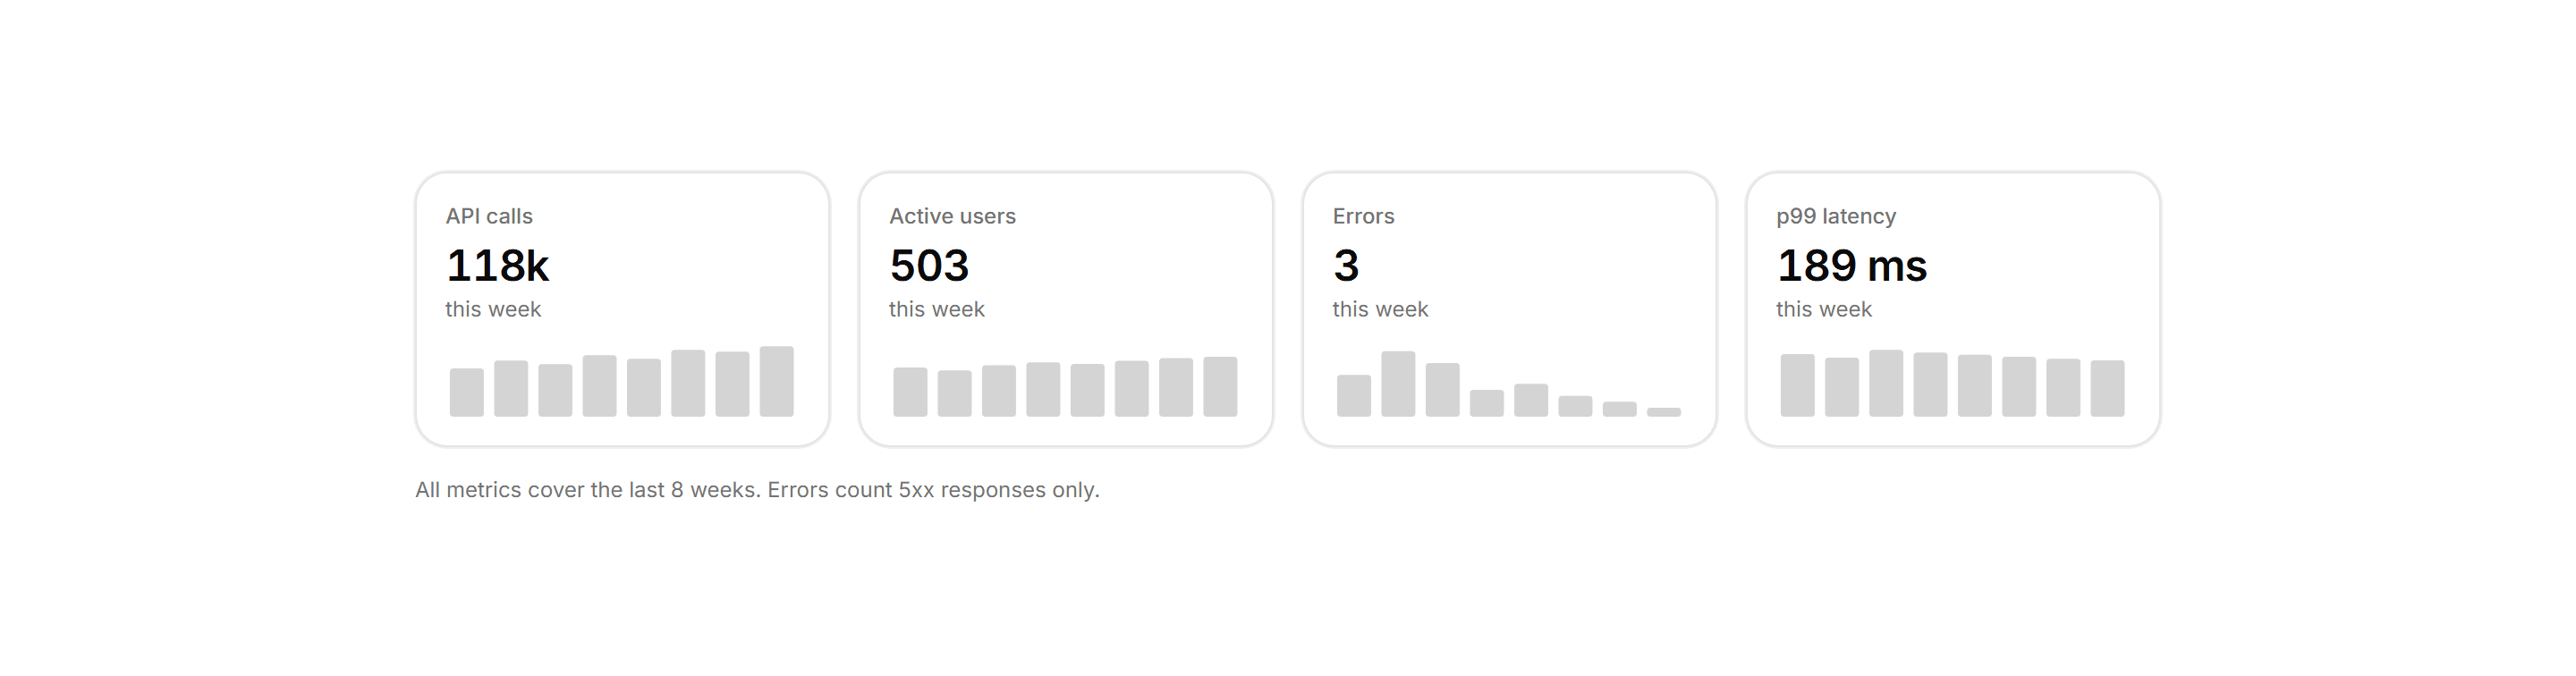

Application Chart: Sparkbar Row
Four compact metric tiles each with a label, headline value, and a mini 8-week bar chart for a glanceable ops comparison strip.
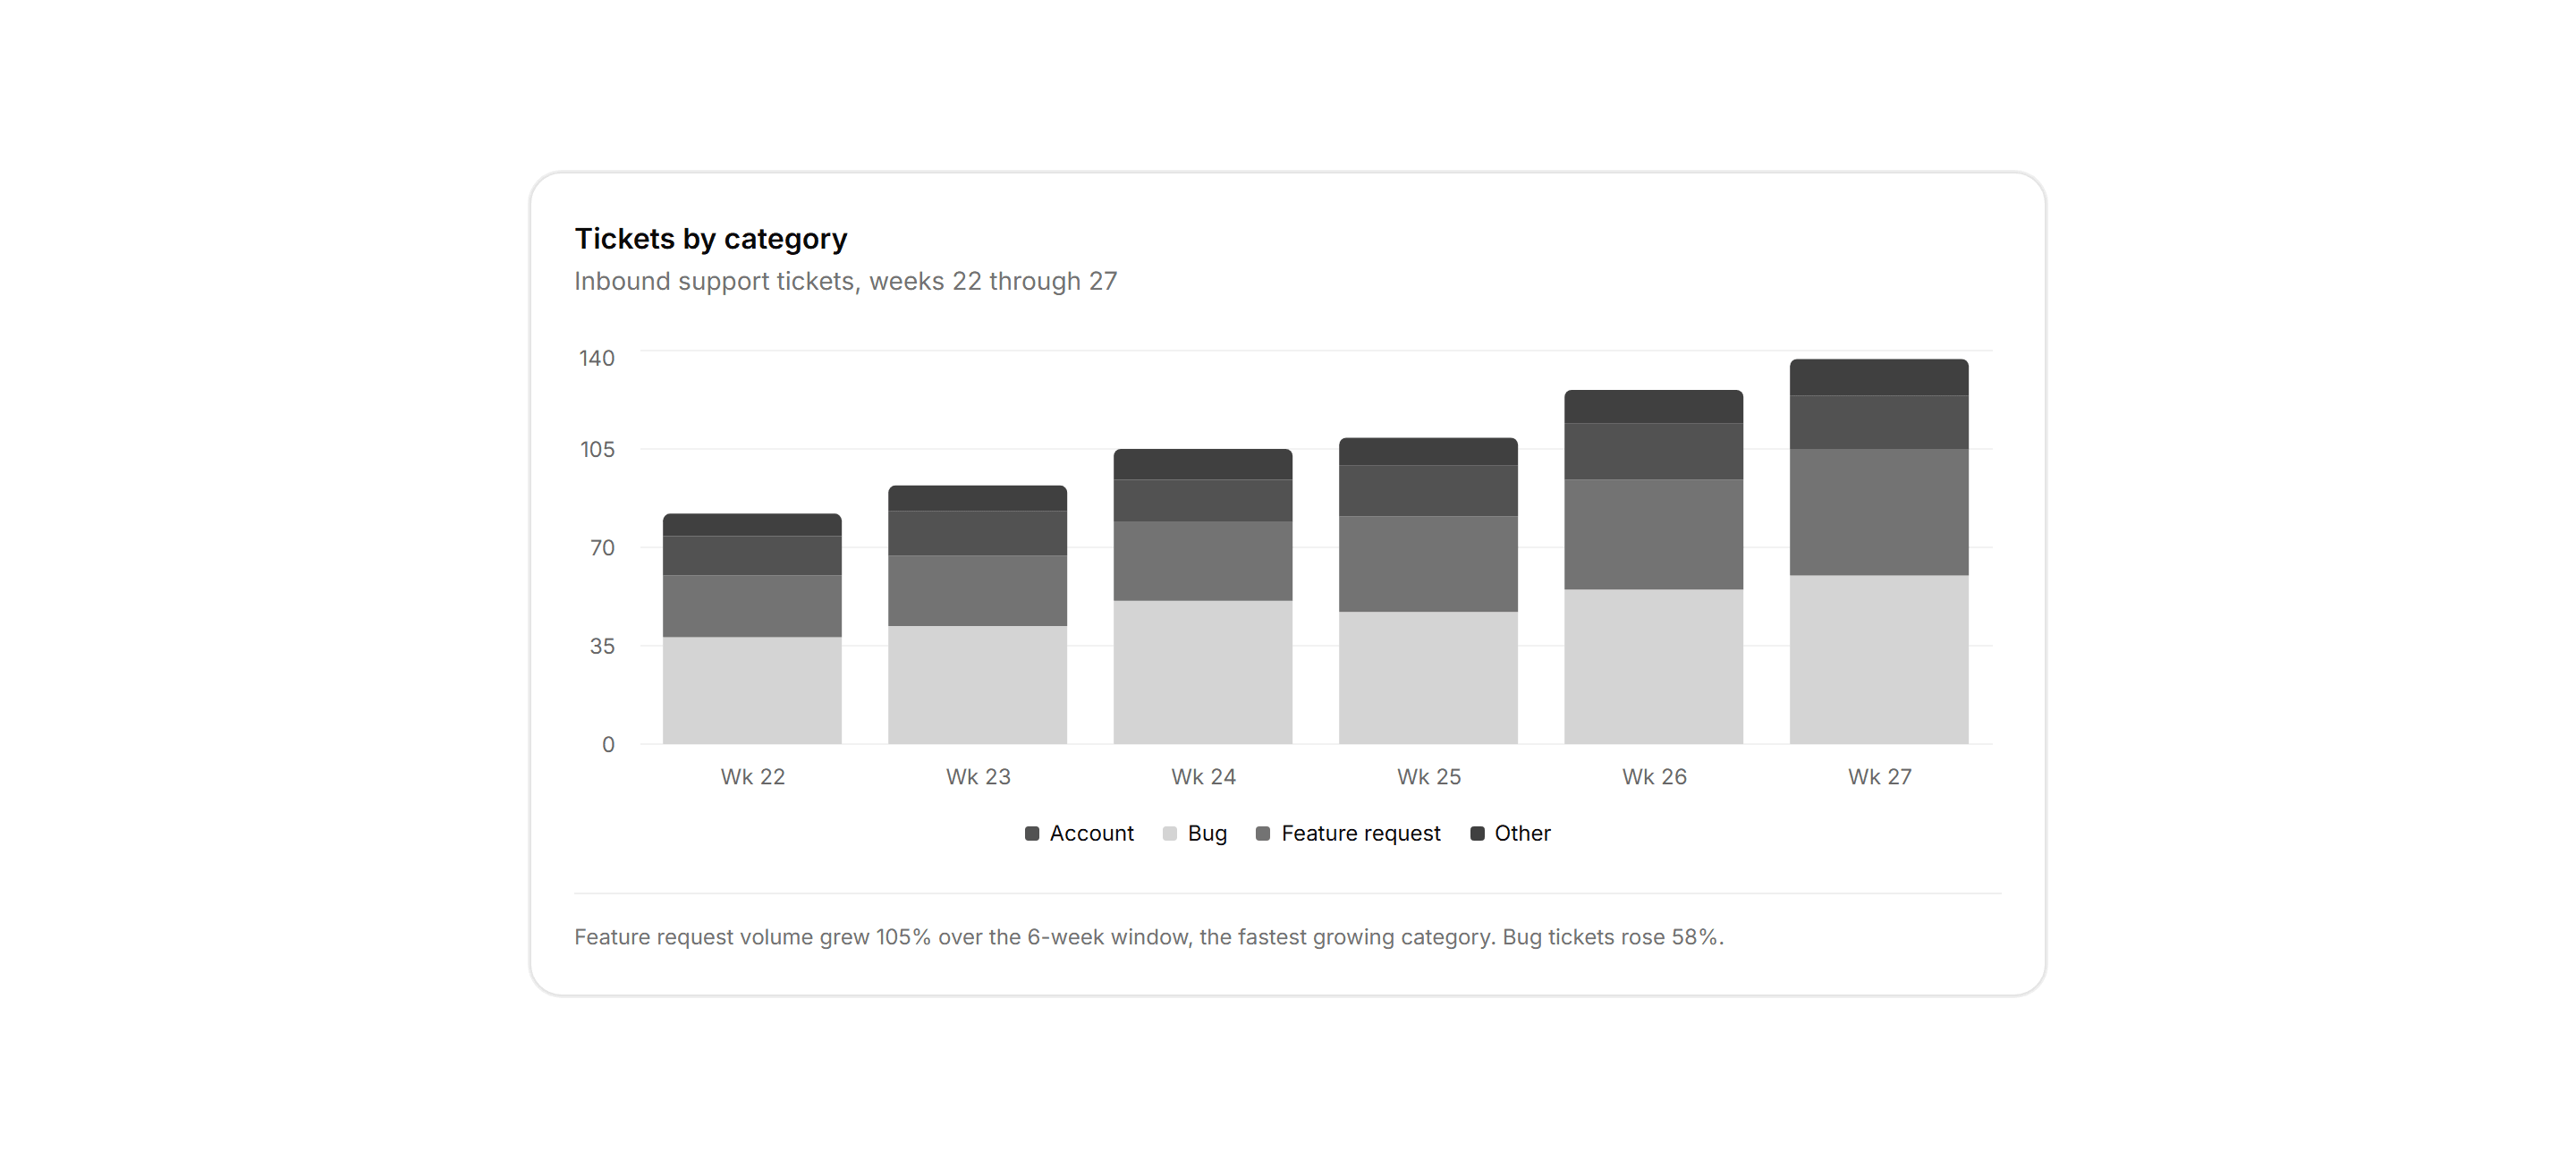

Application Chart: Stacked Category Bars
A stacked bar chart of support tickets by category over six weeks with a footnote naming the fastest growing series.
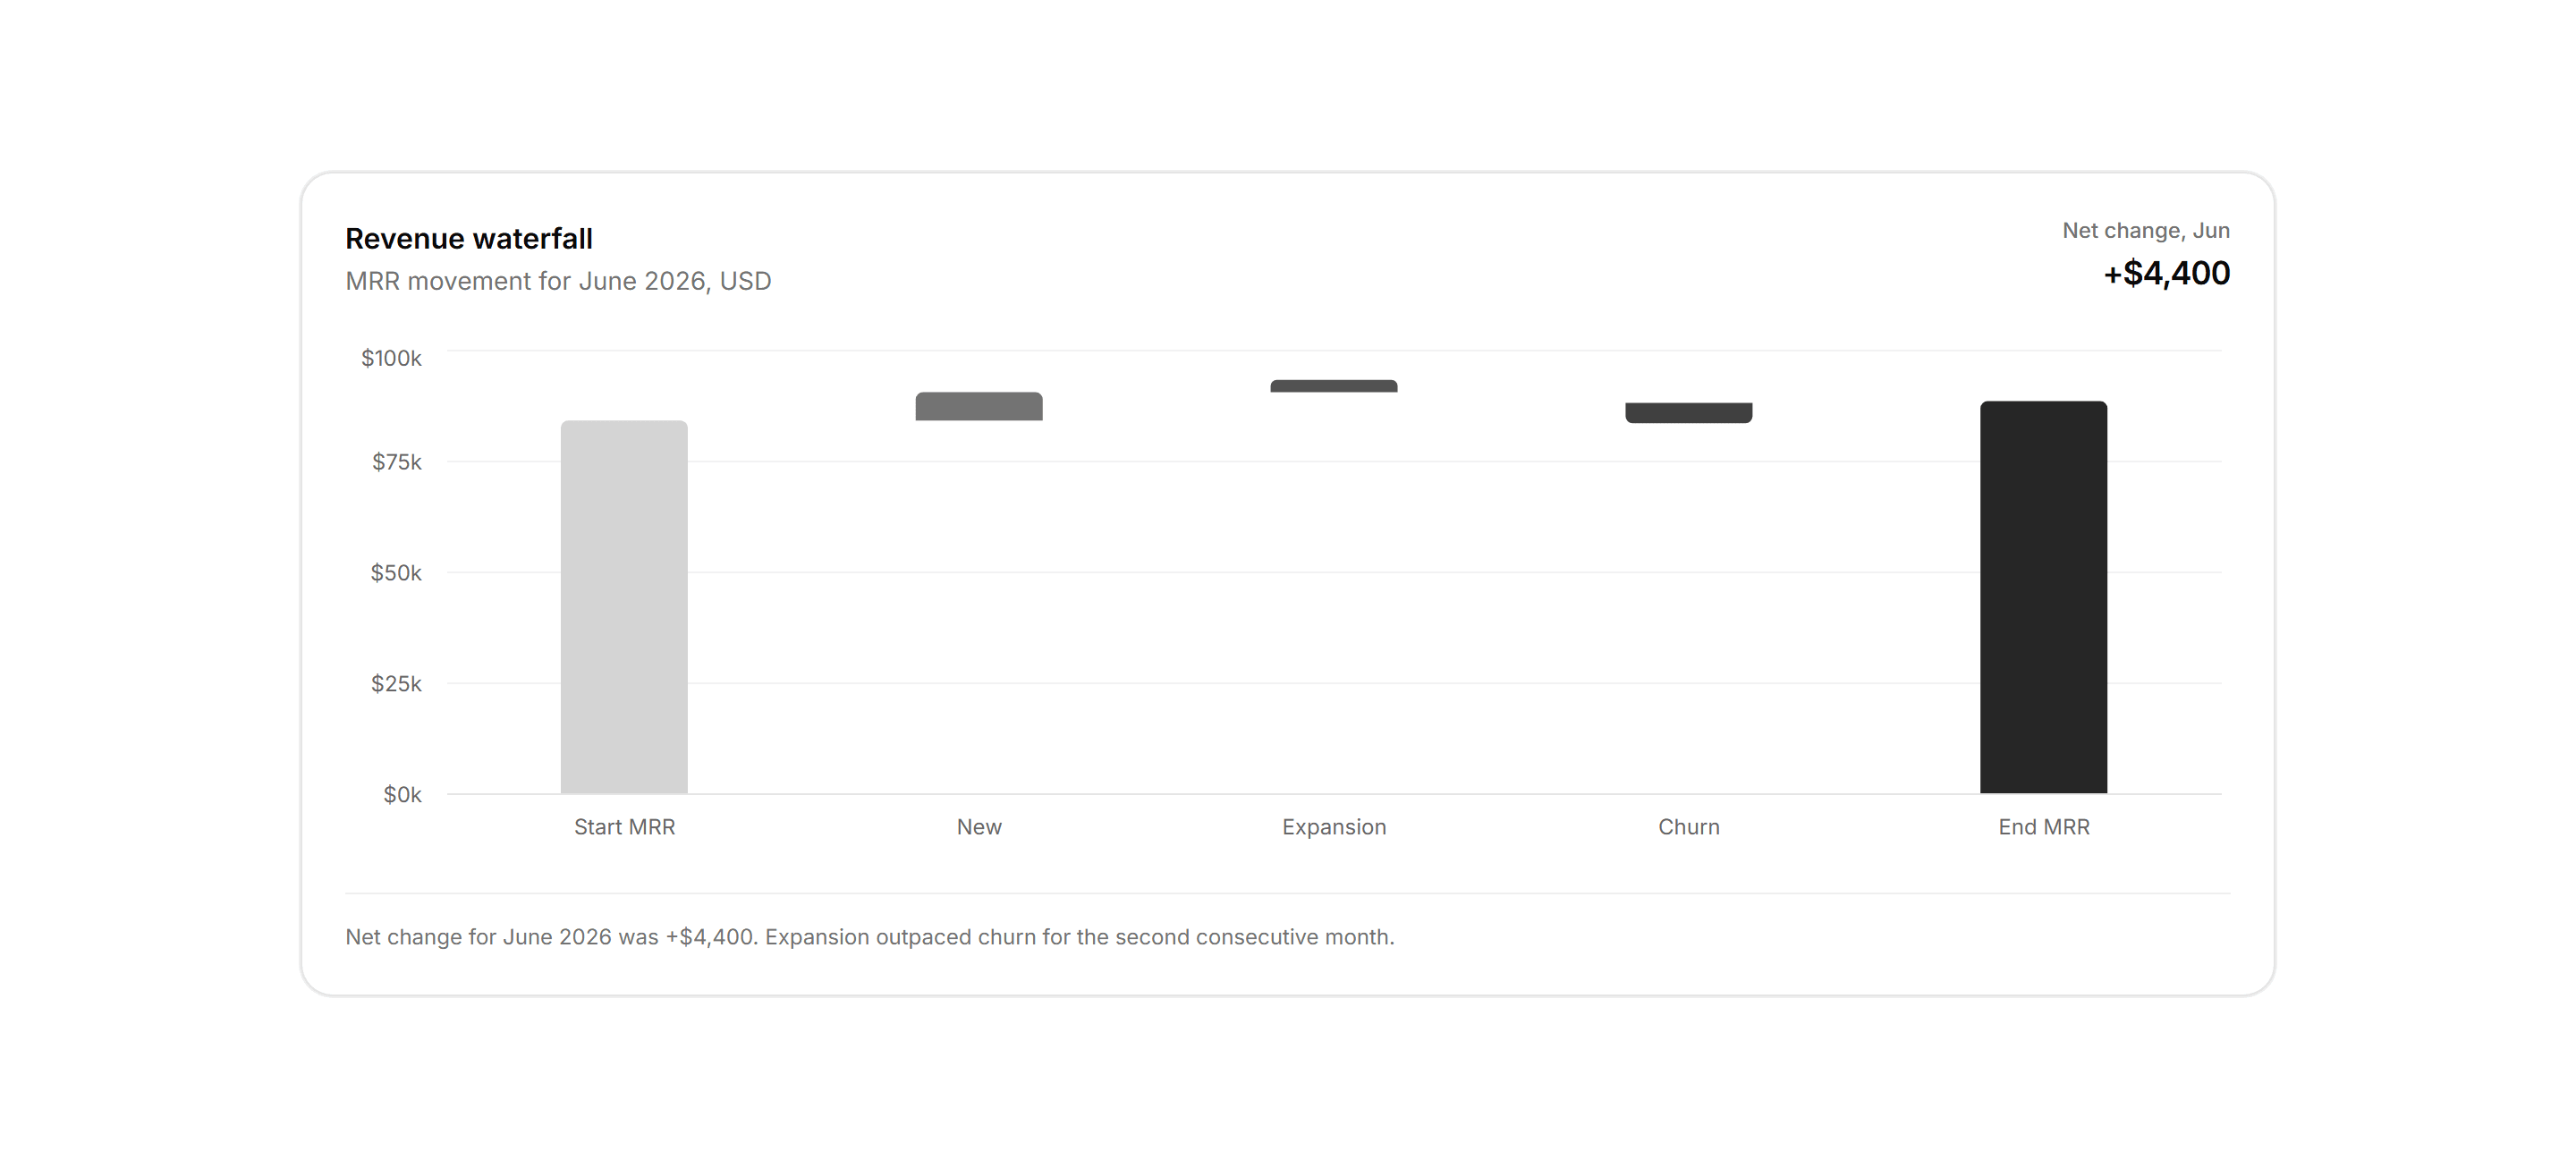

Application Chart: Waterfall Chart
MRR movement chart with floating bars for new business, expansion, and churn across a billing period.

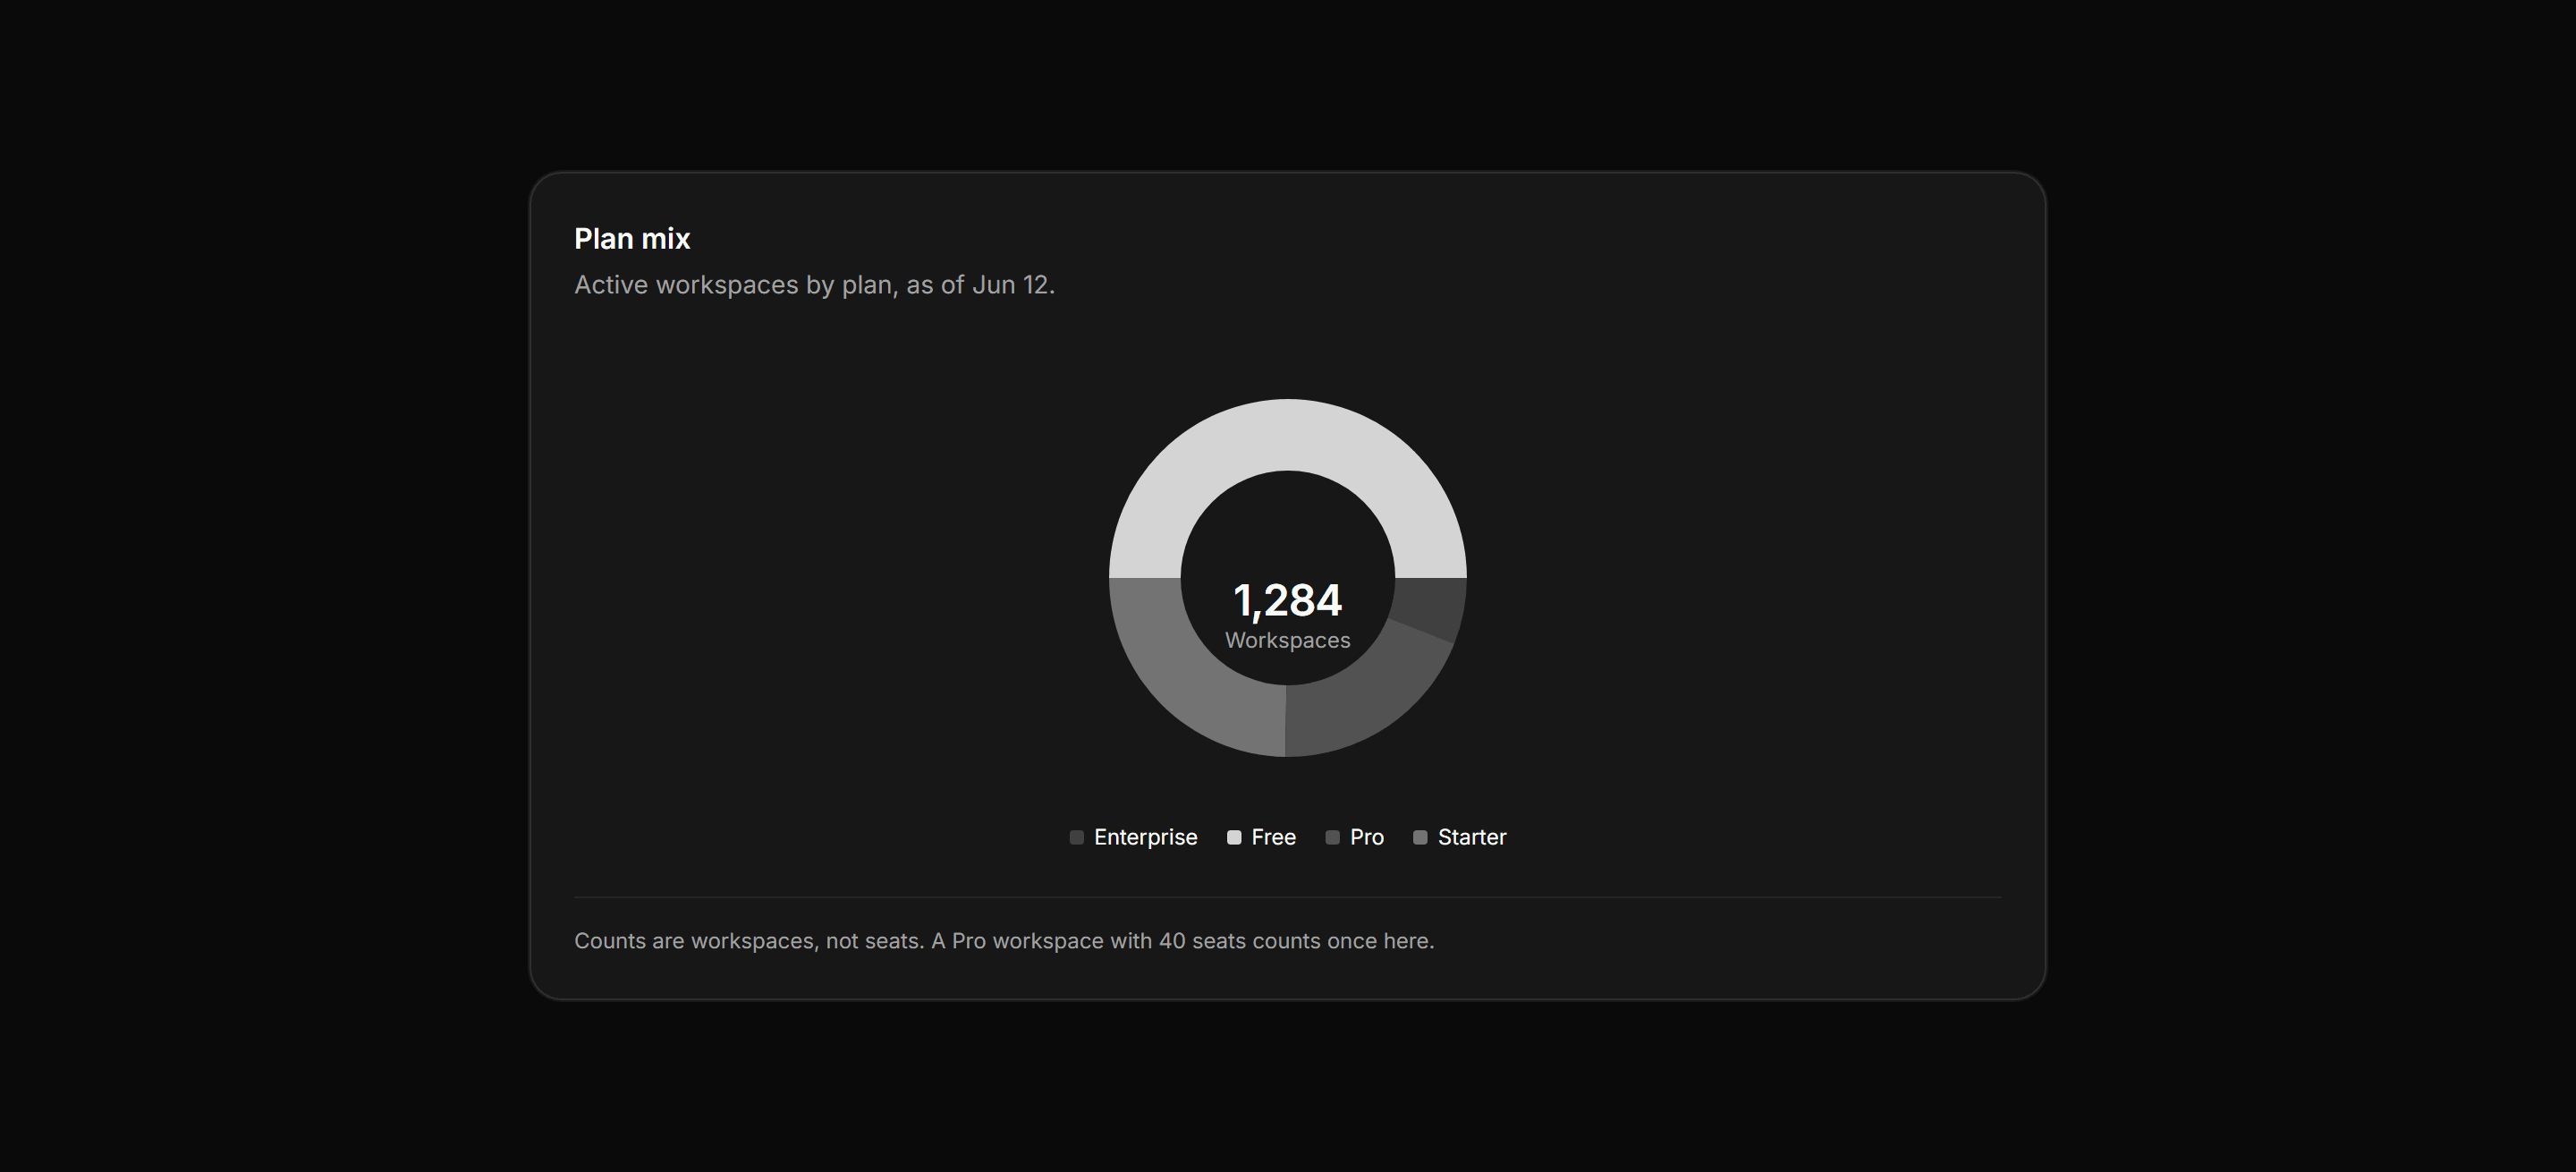
Application Chart: Plan Mix Donut
Donut chart of active workspaces by plan tier with a center total label and a four plan legend.
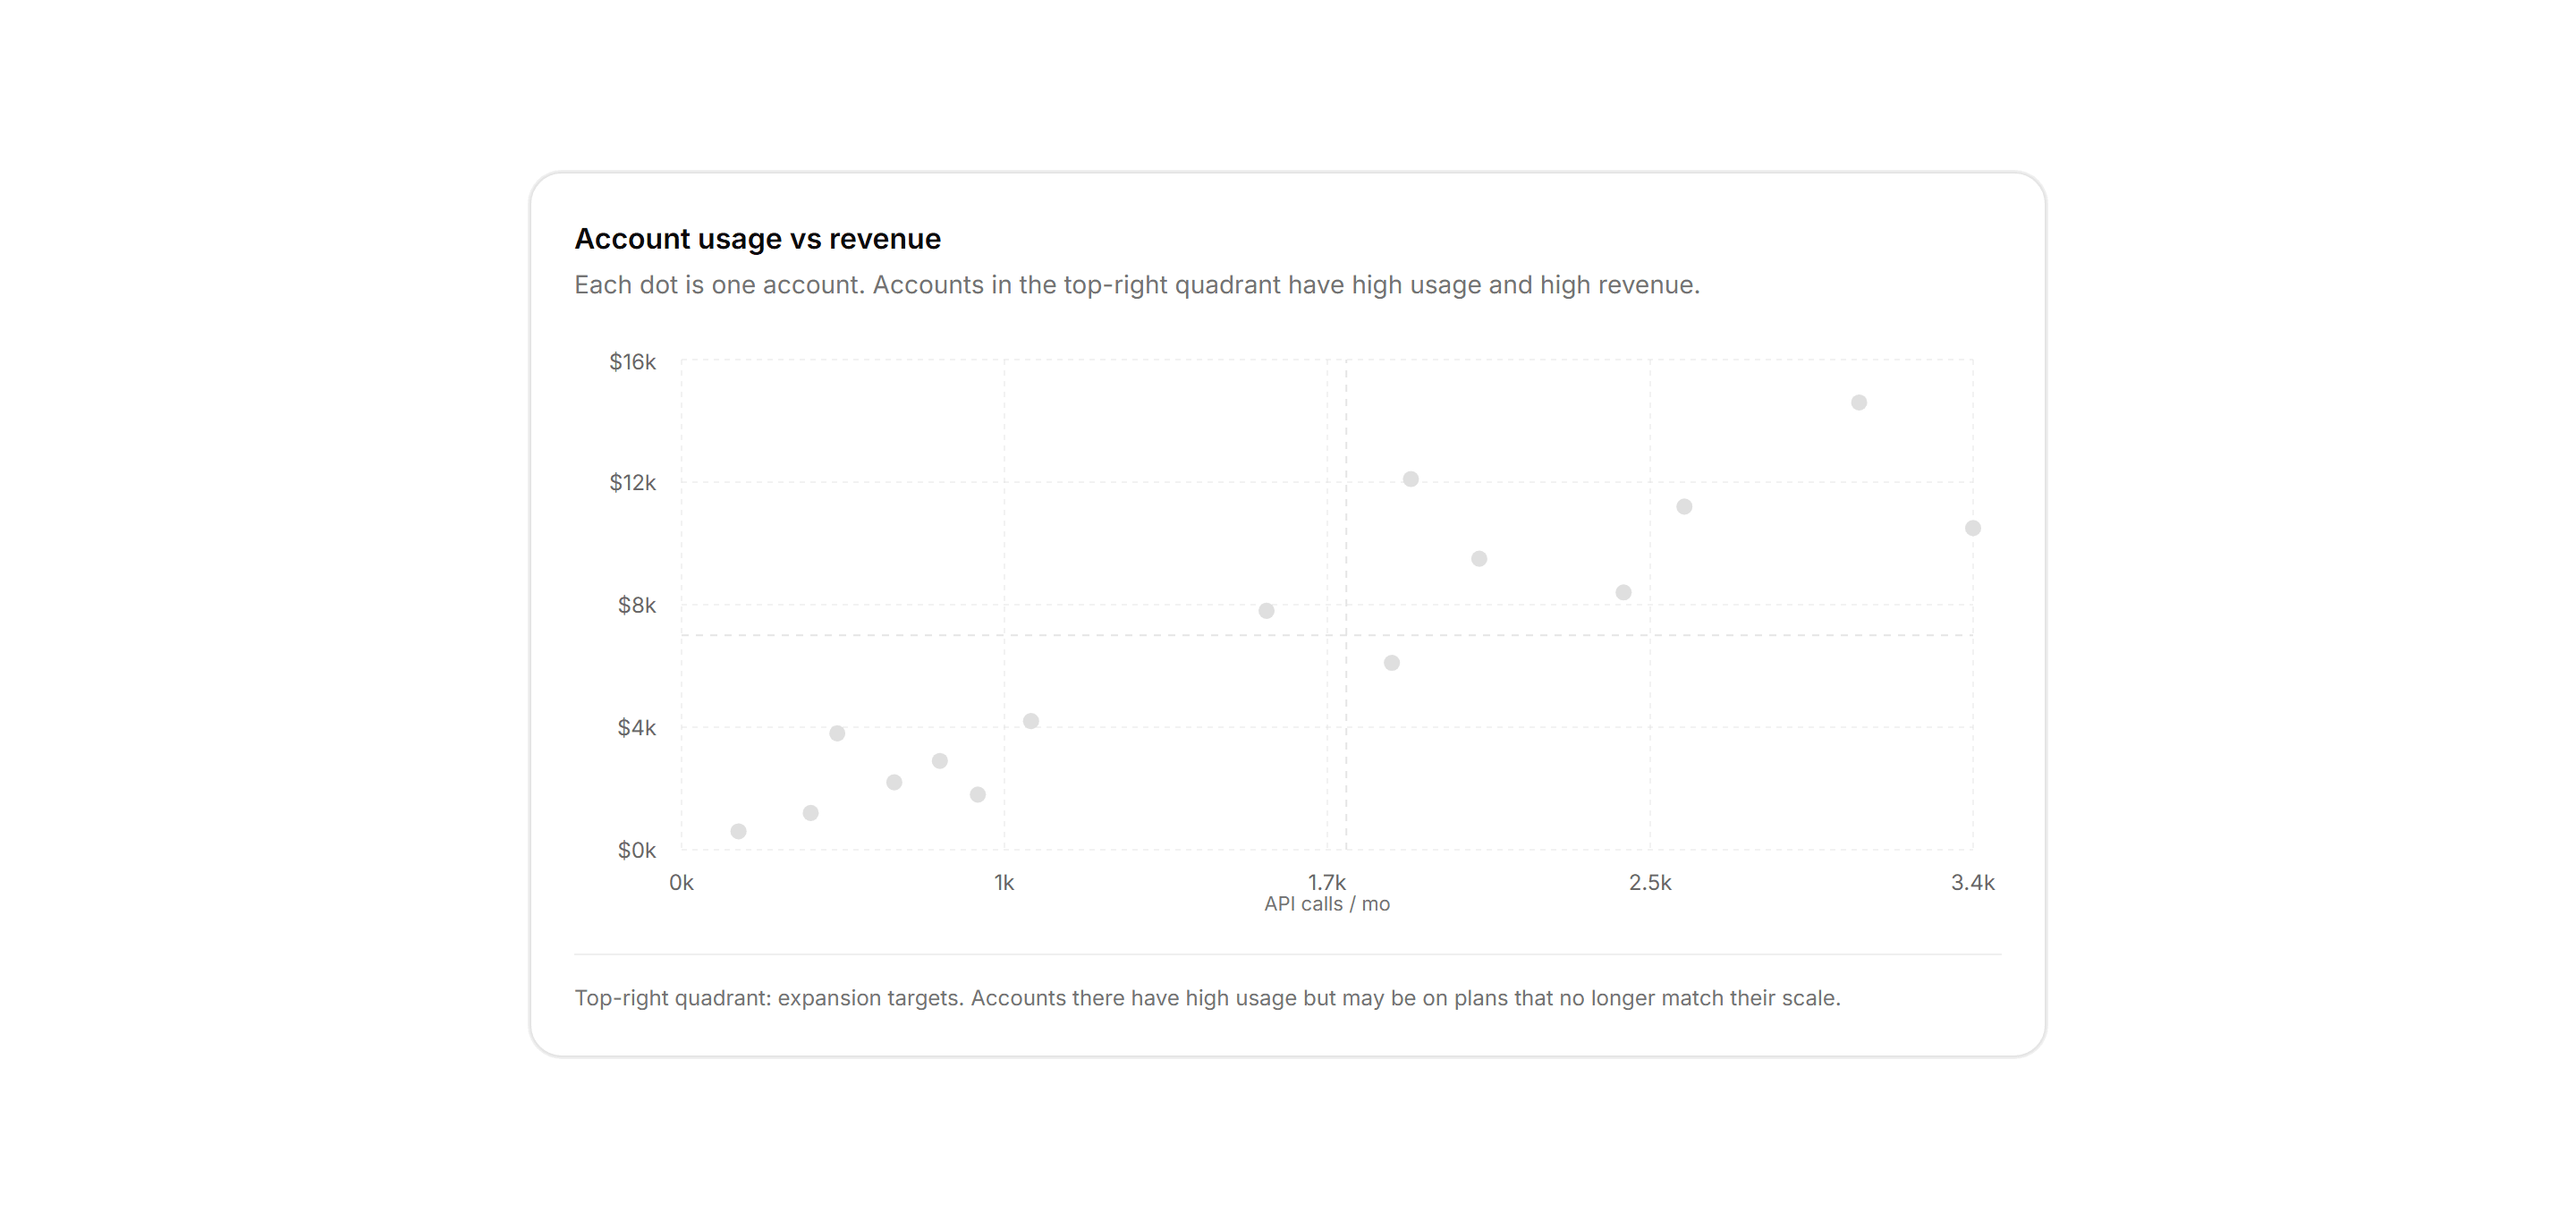
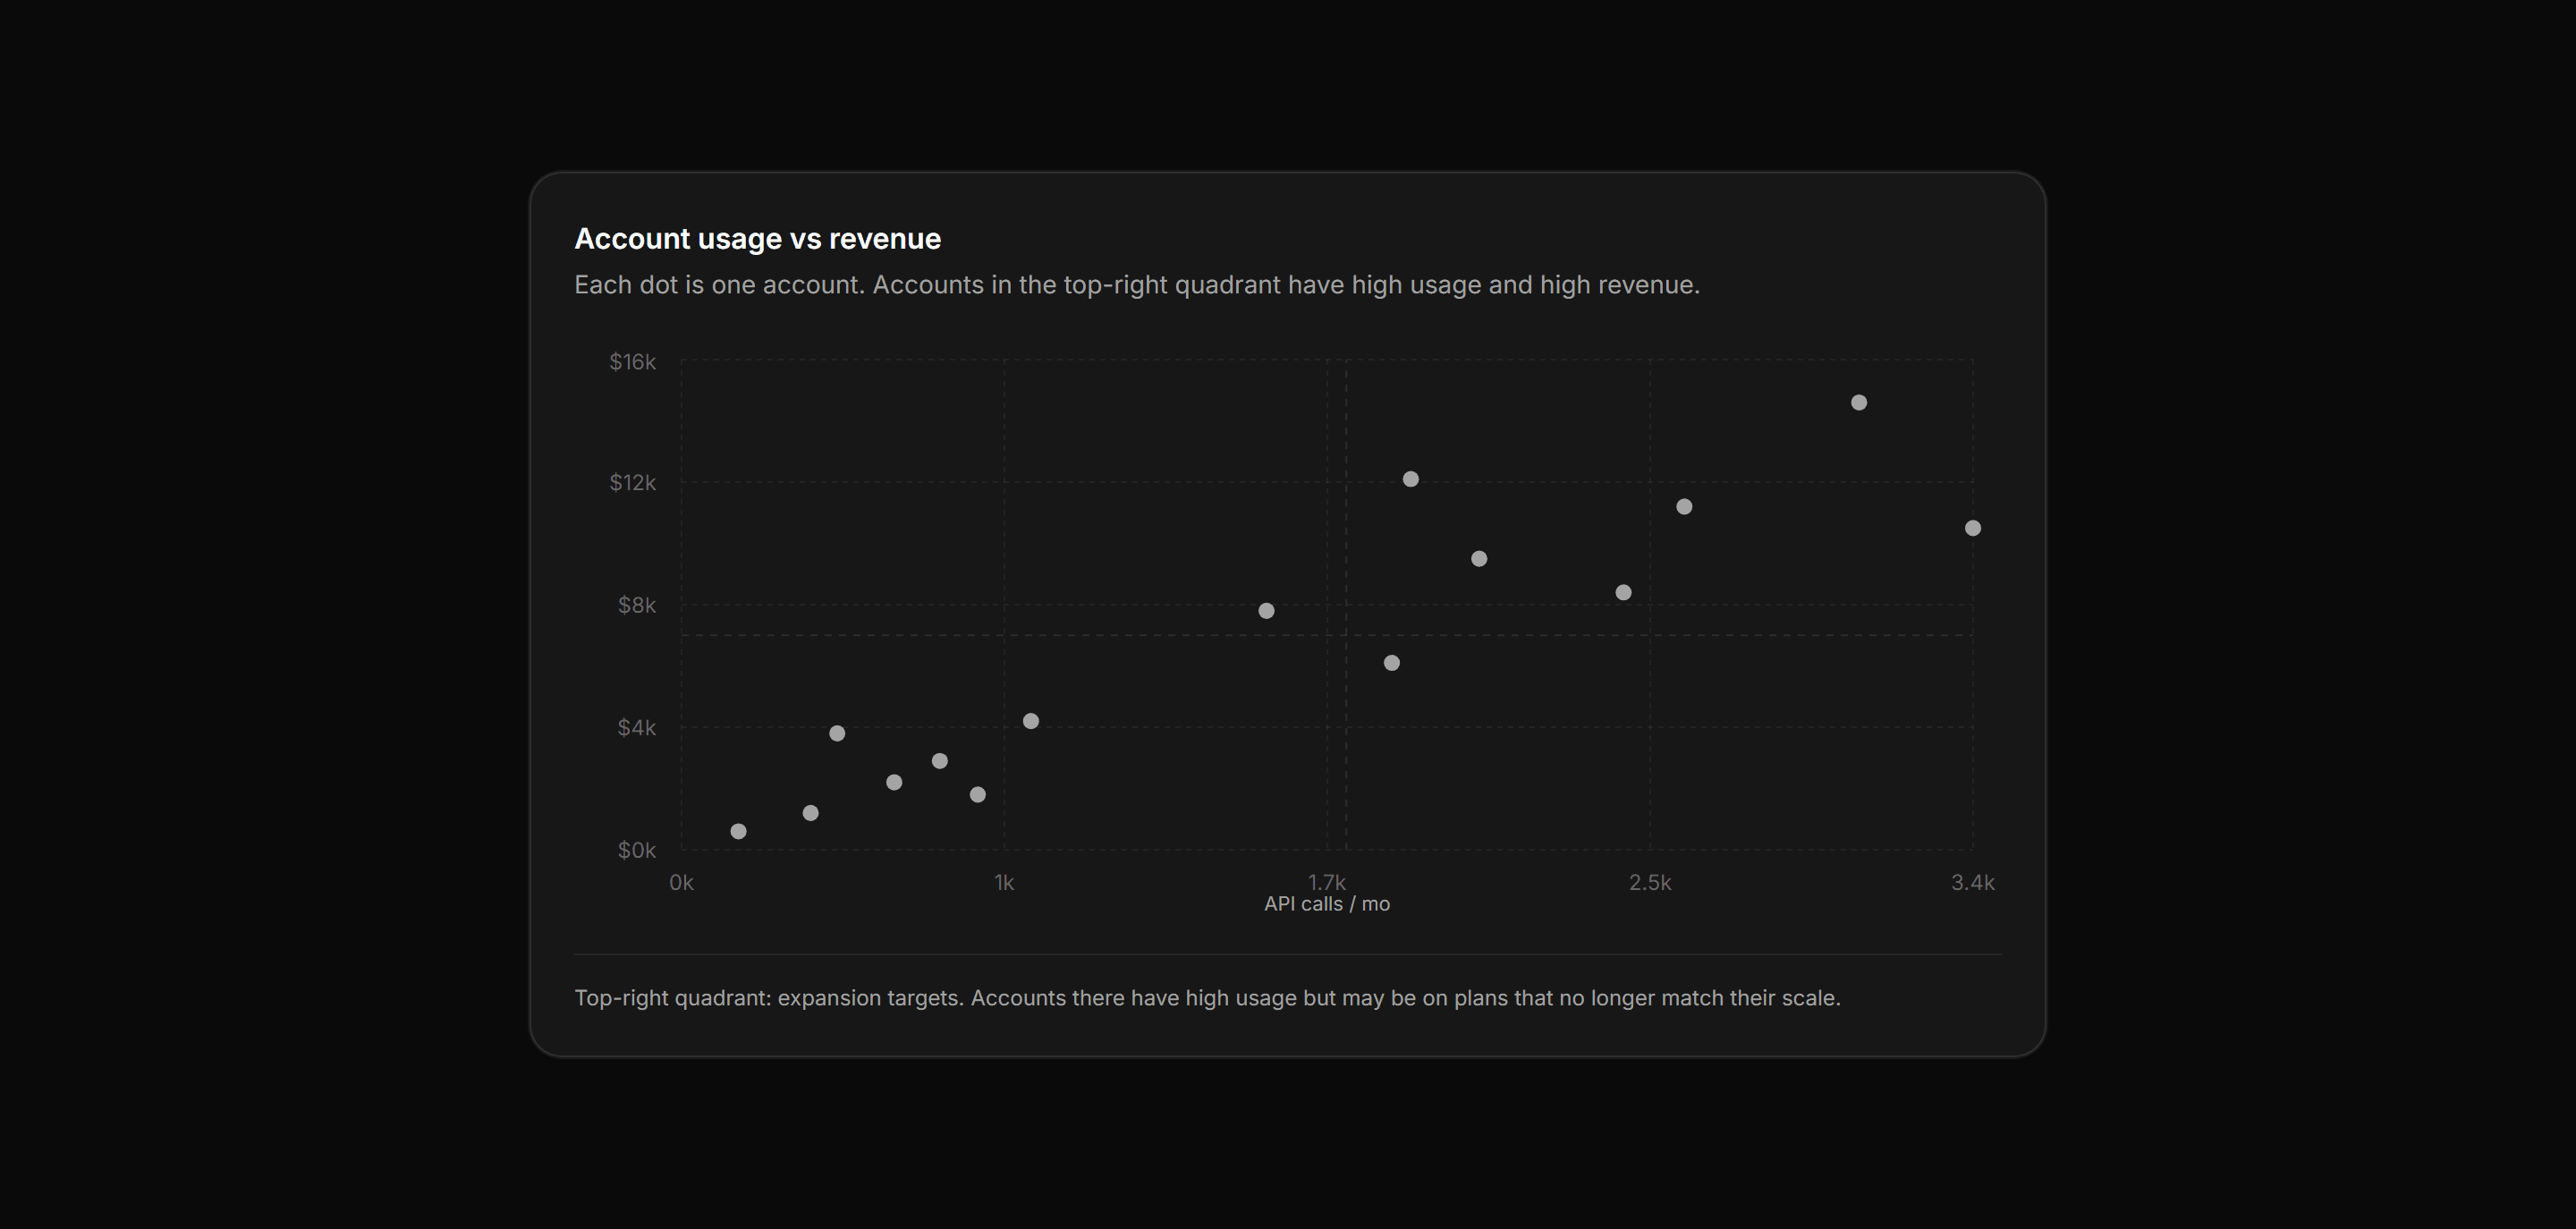
Application Chart: Scatter Plot Chart
Accounts scatter chart plotting monthly API usage against revenue with reference-line quadrants to surface expansion targets.
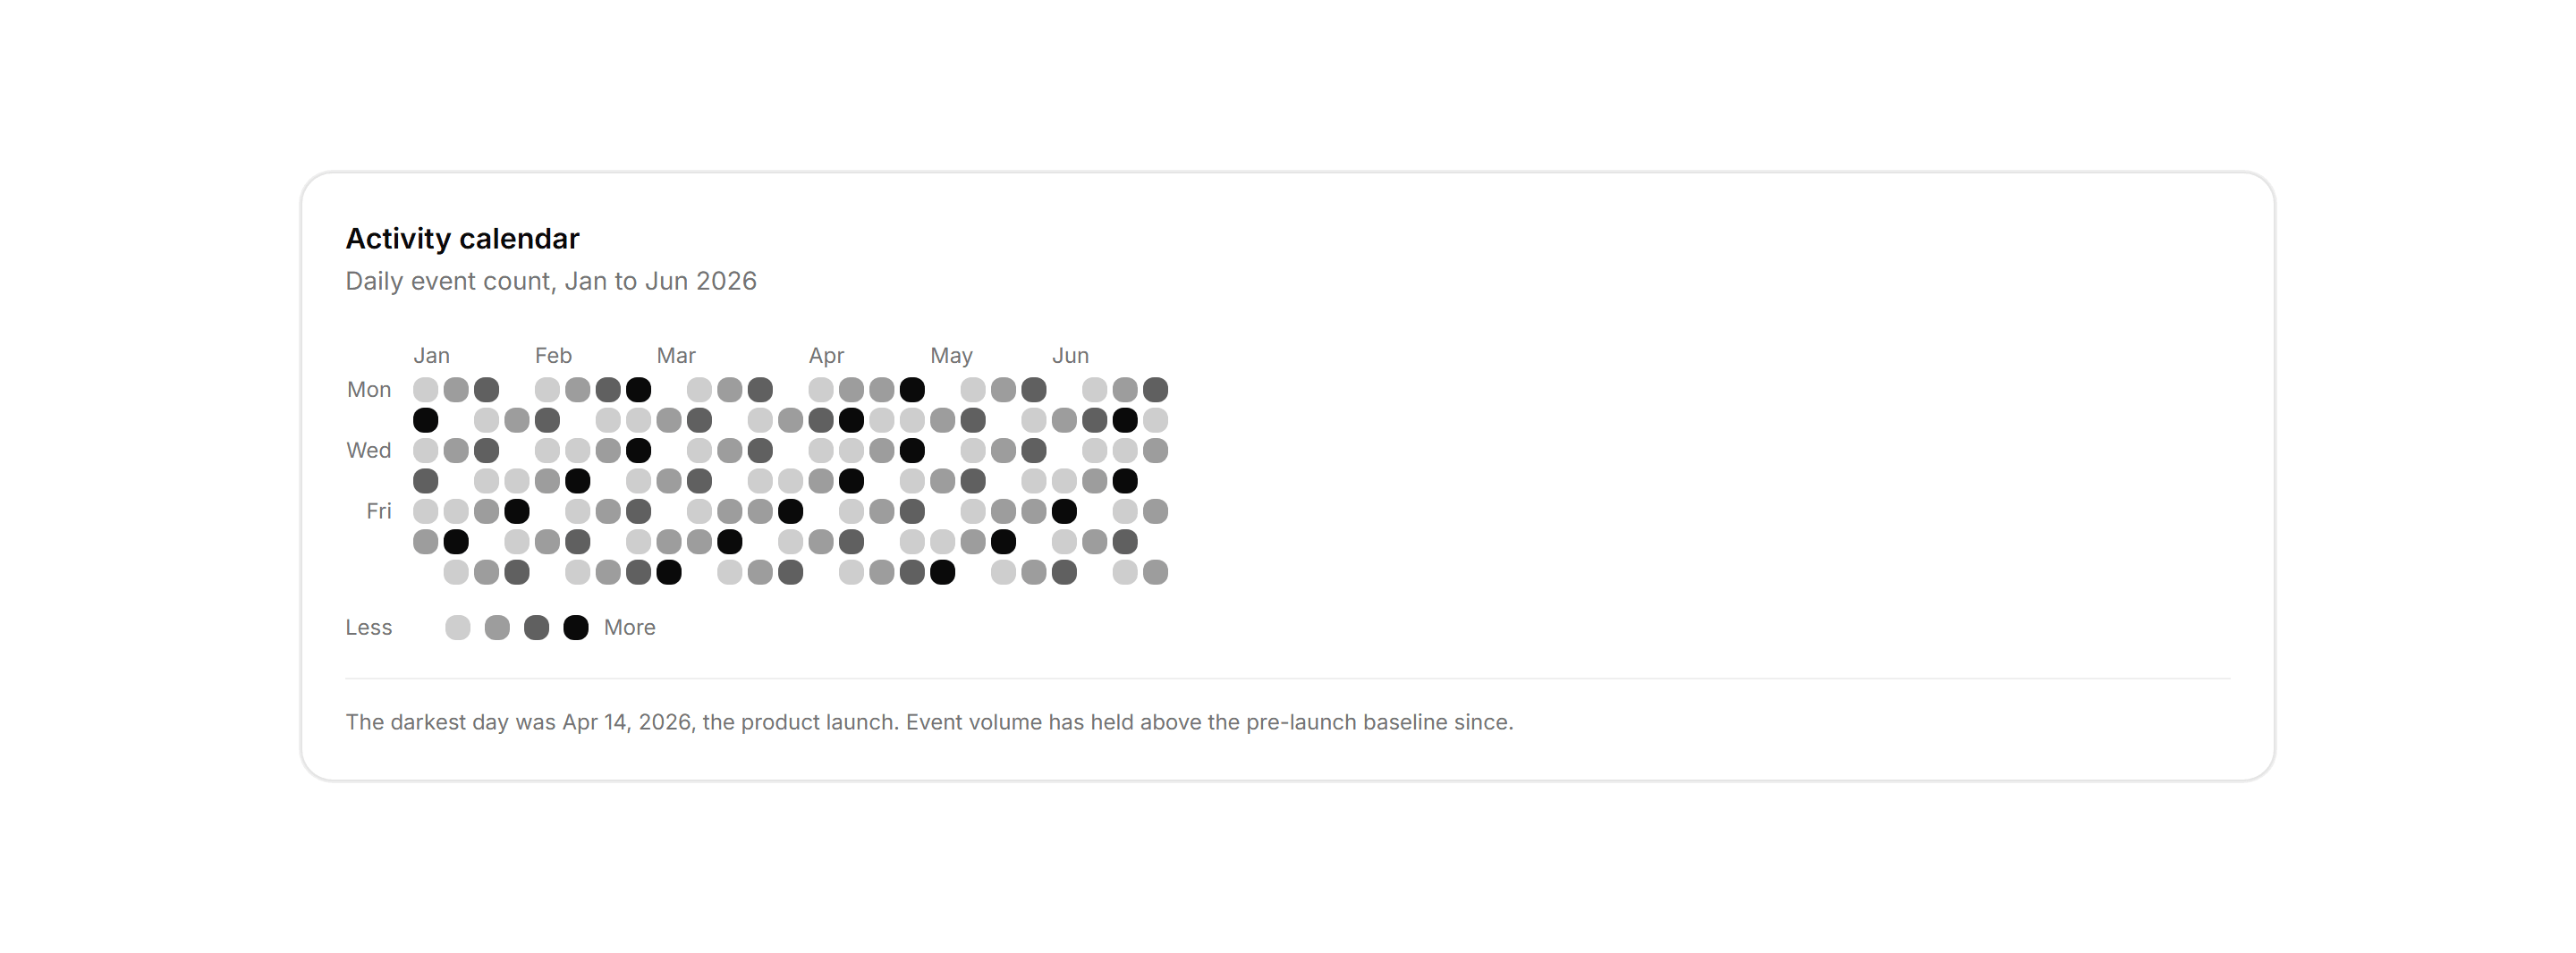

Application Chart: Heatmap Calendar Chart
CSS grid calendar heatmap shading daily activity by foreground opacity across a six month window.


Application Chart: Mrr Stacked Bars
MRR movement as stacked bars with new and expansion above zero and contraction and churn below, last 6 months.
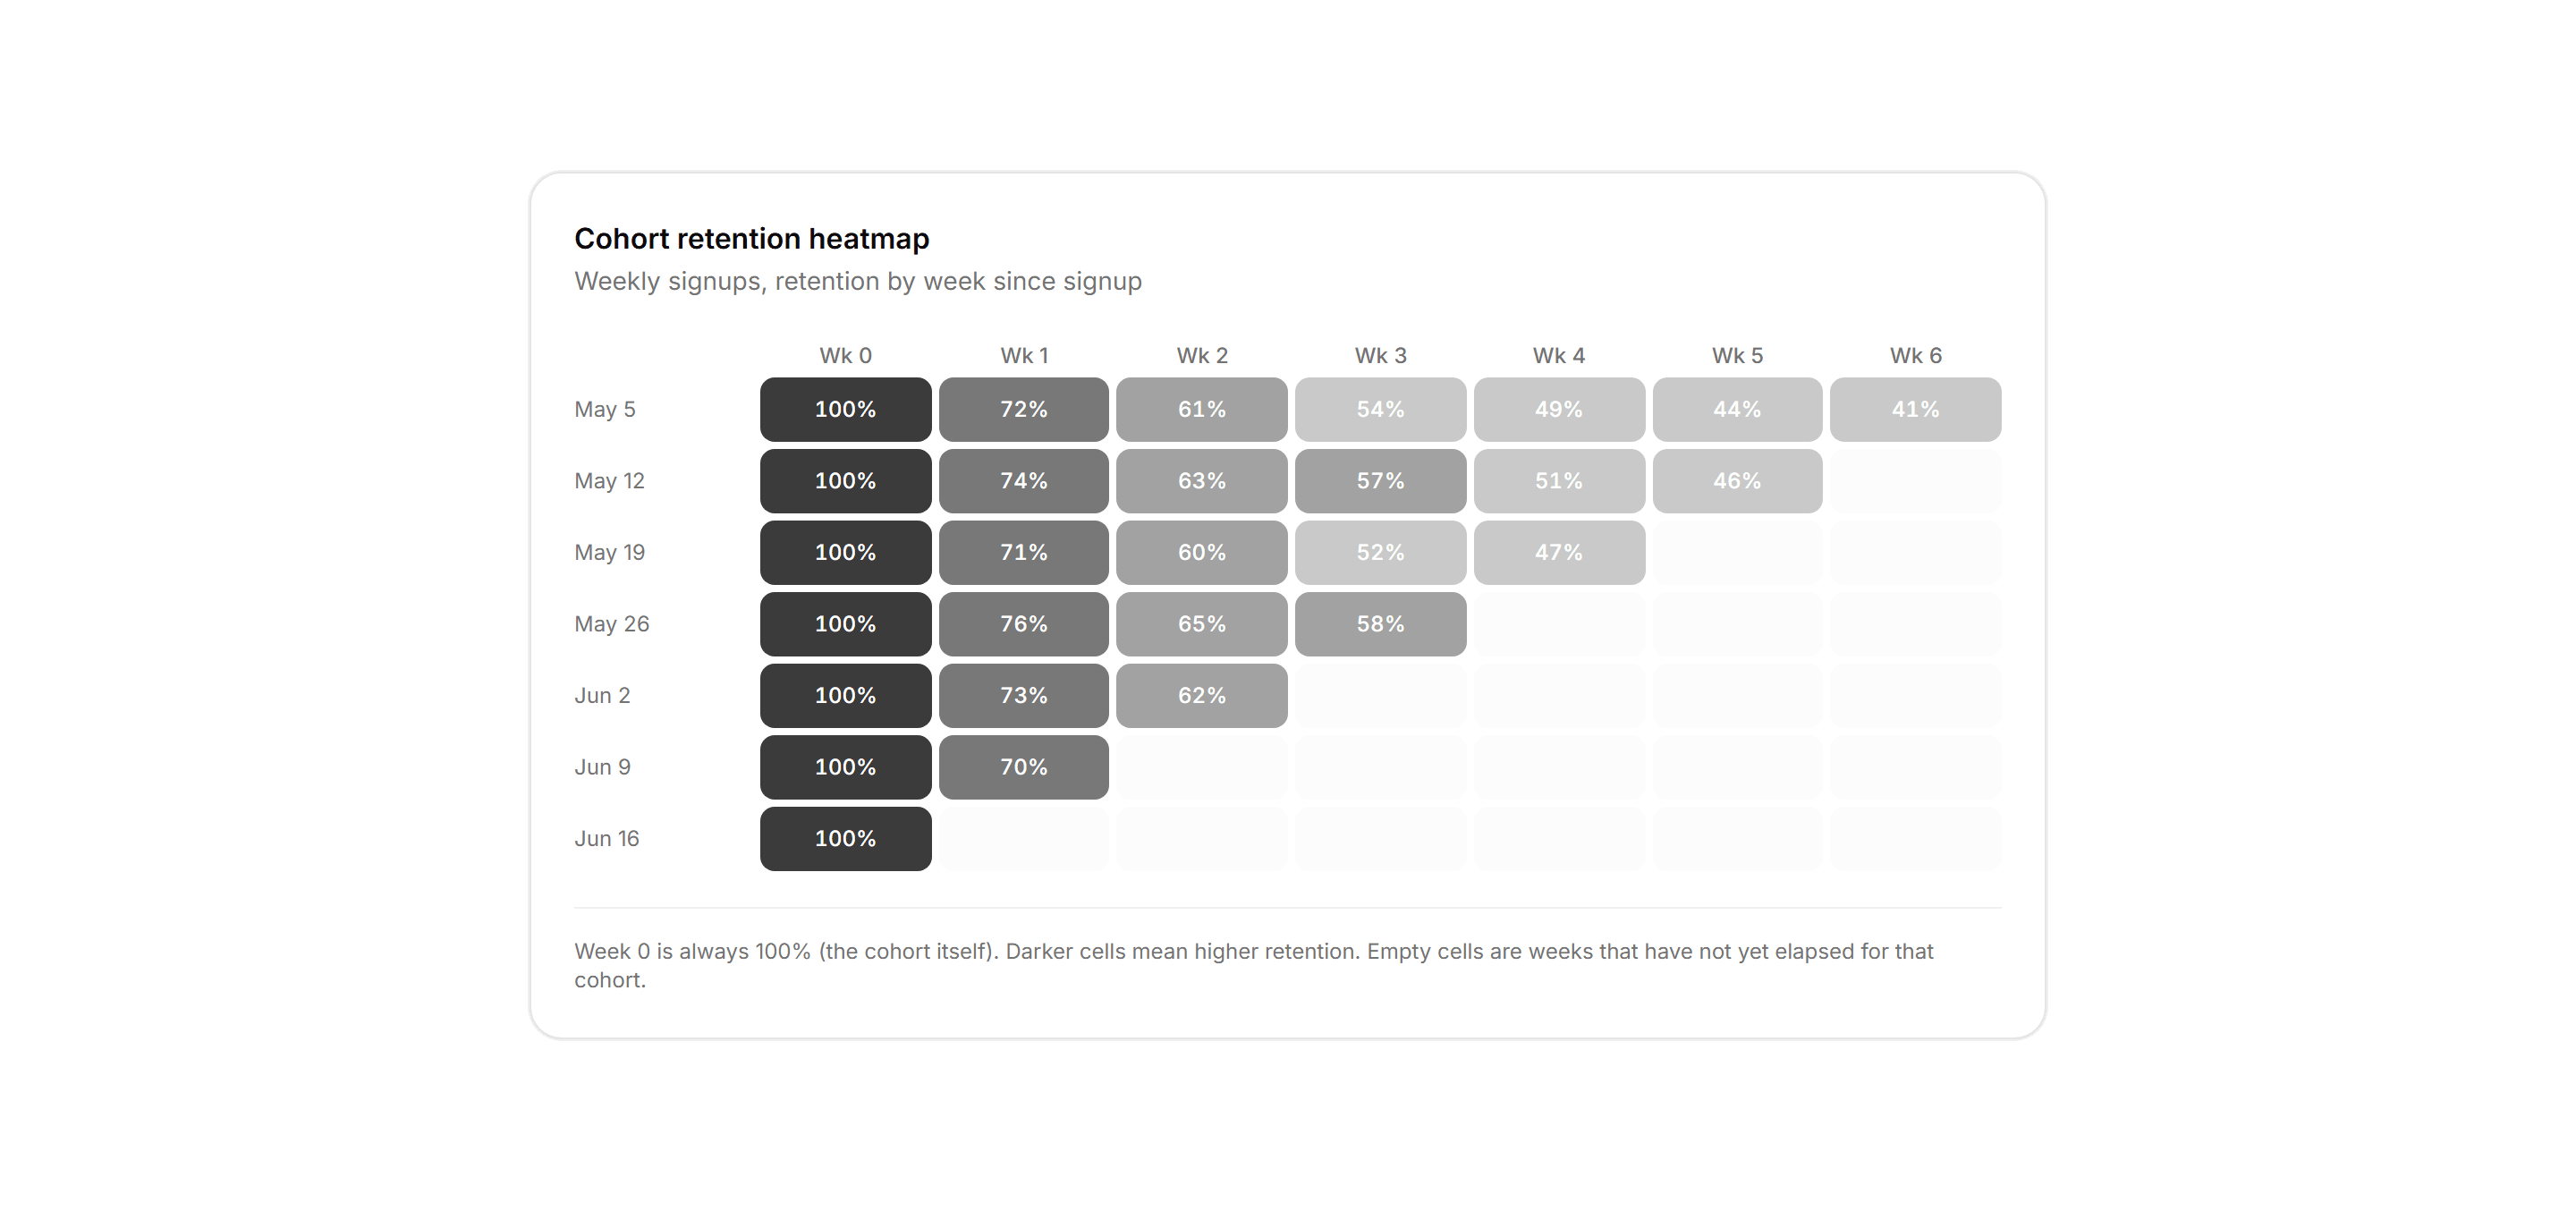
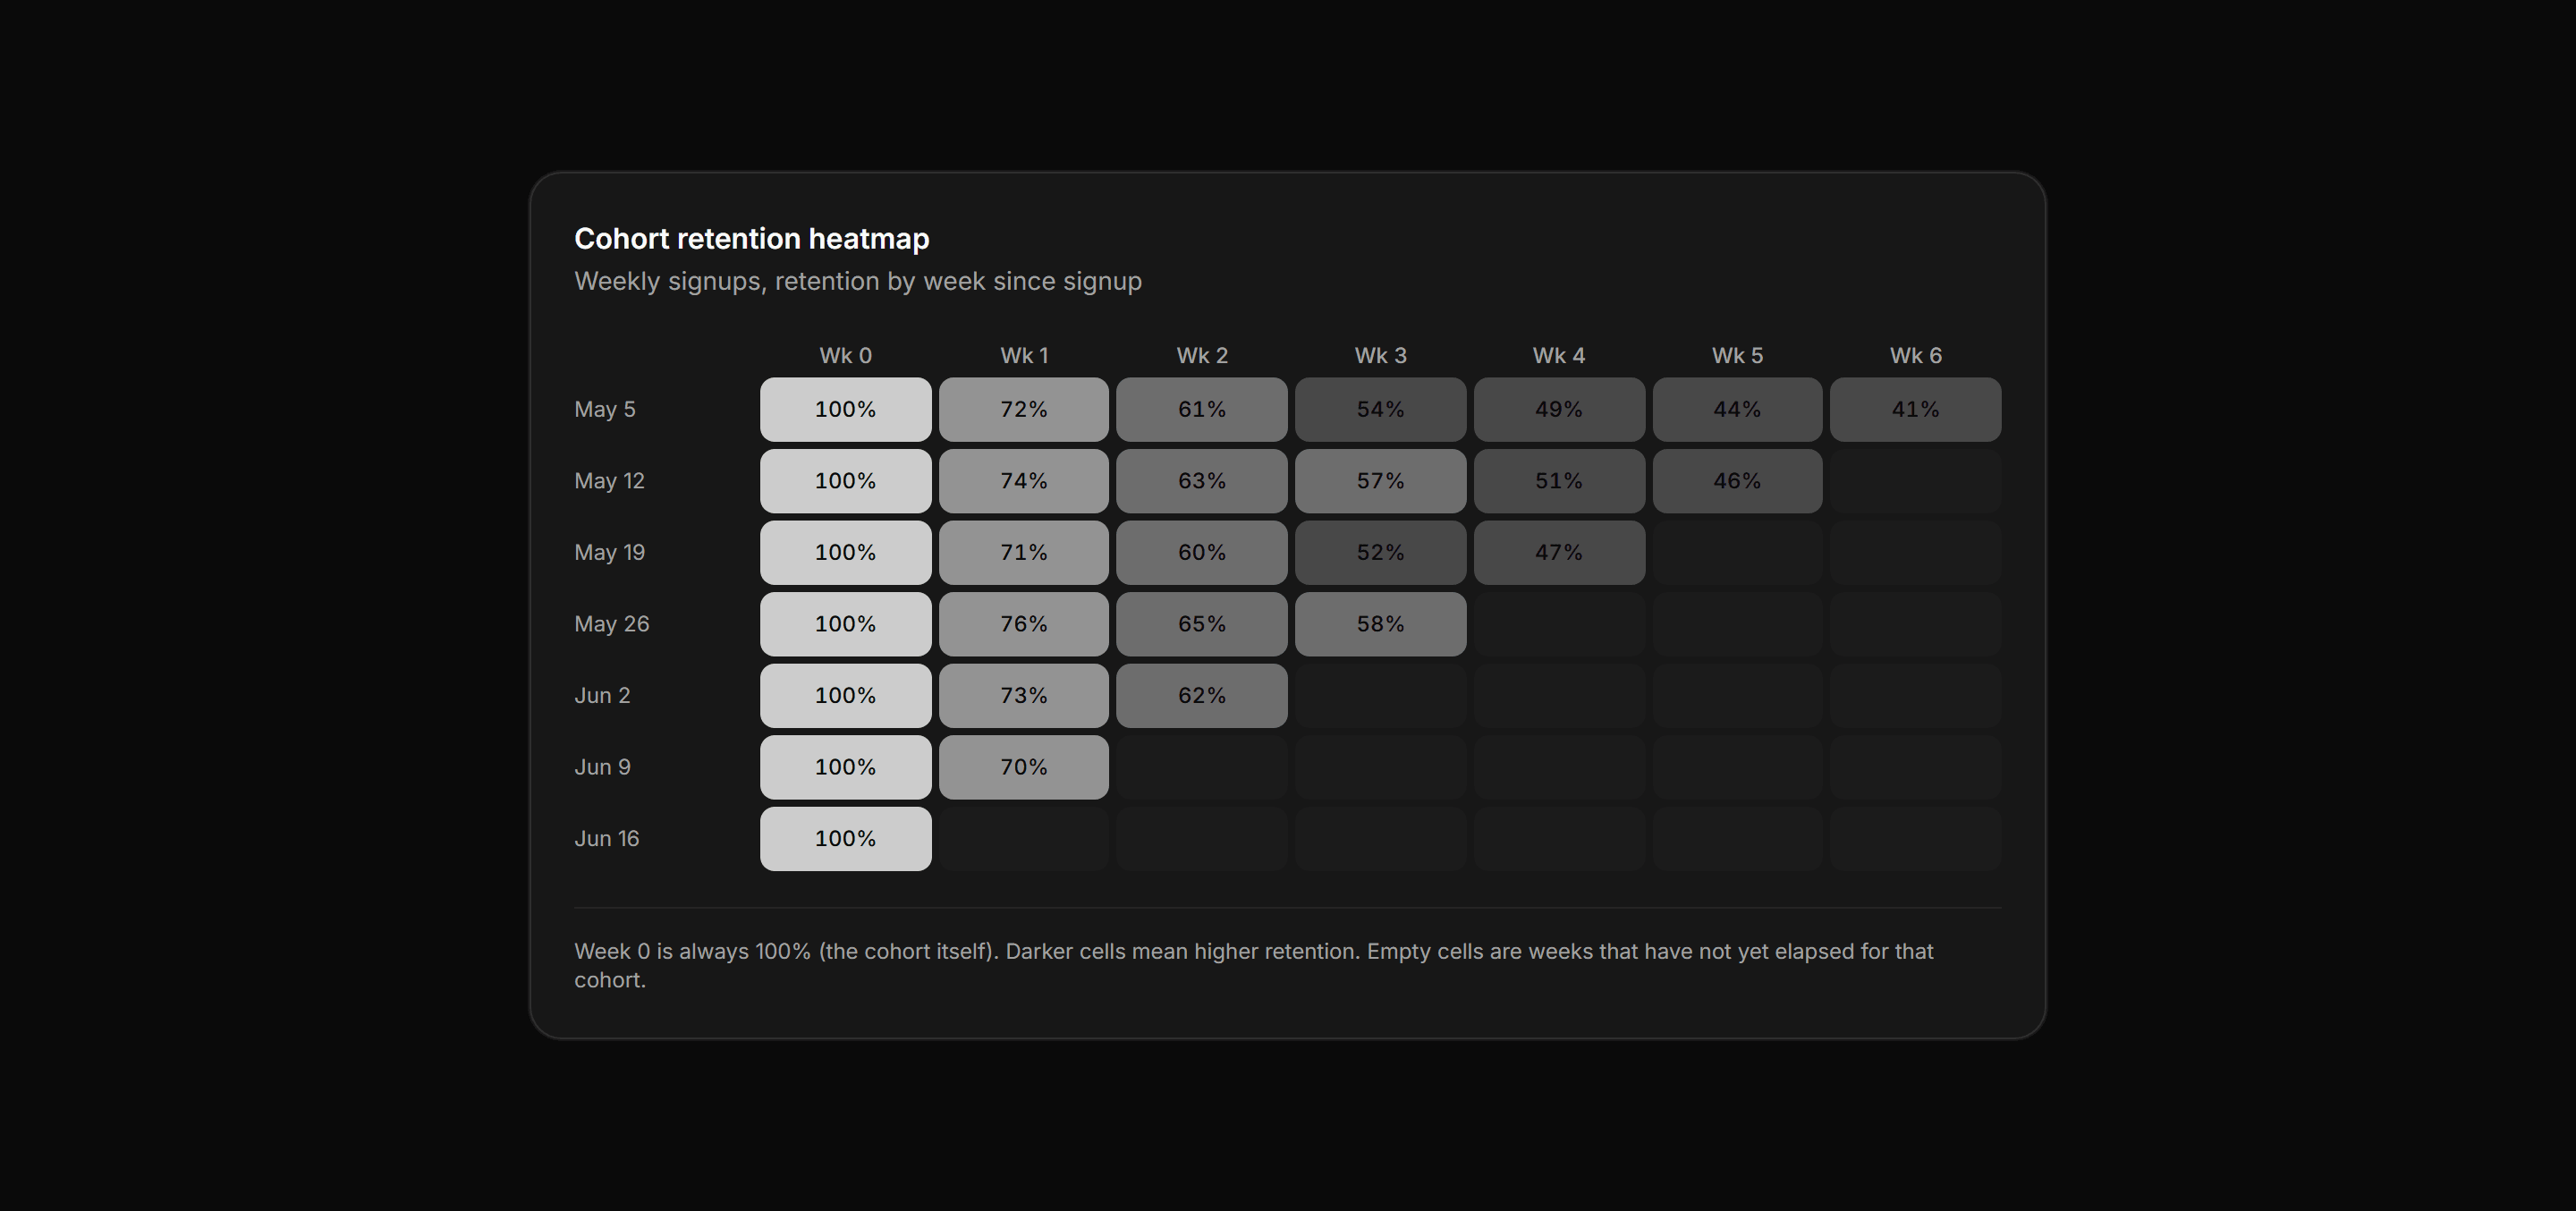
Application Chart: Cohort Retention Heatmap
A CSS grid heatmap of weekly cohort retention shaded by foreground opacity tokens with no chart library.

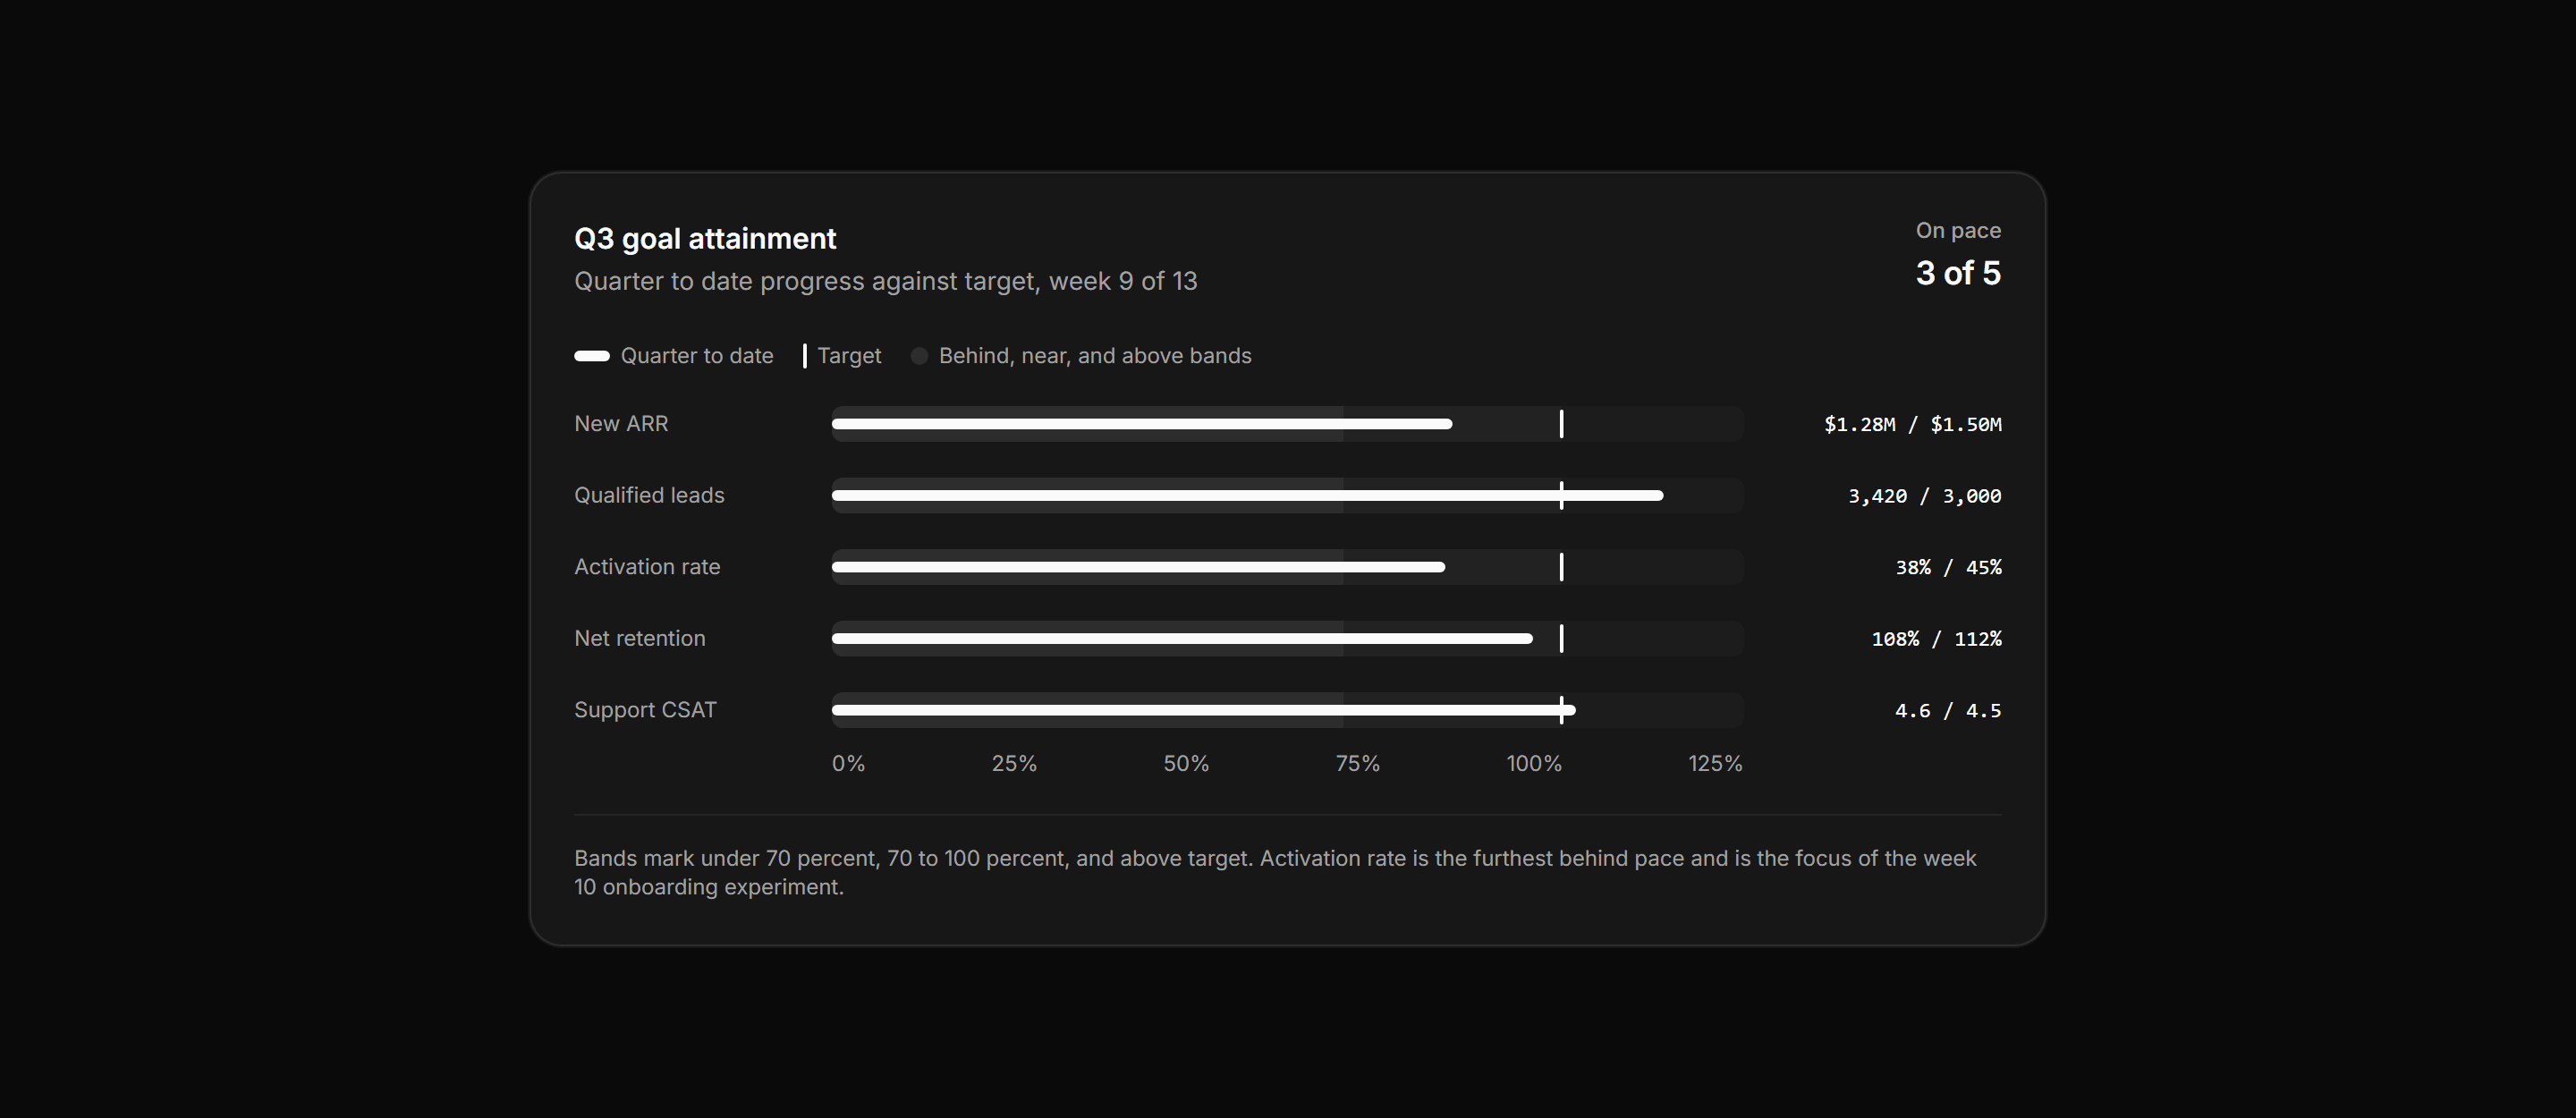
Application Chart: Bullet KPI Rows
A card panel of five quarterly KPIs as bullet rows, each with qualitative range bands, a quarter to date measure bar, a target tick, and a shared axis.
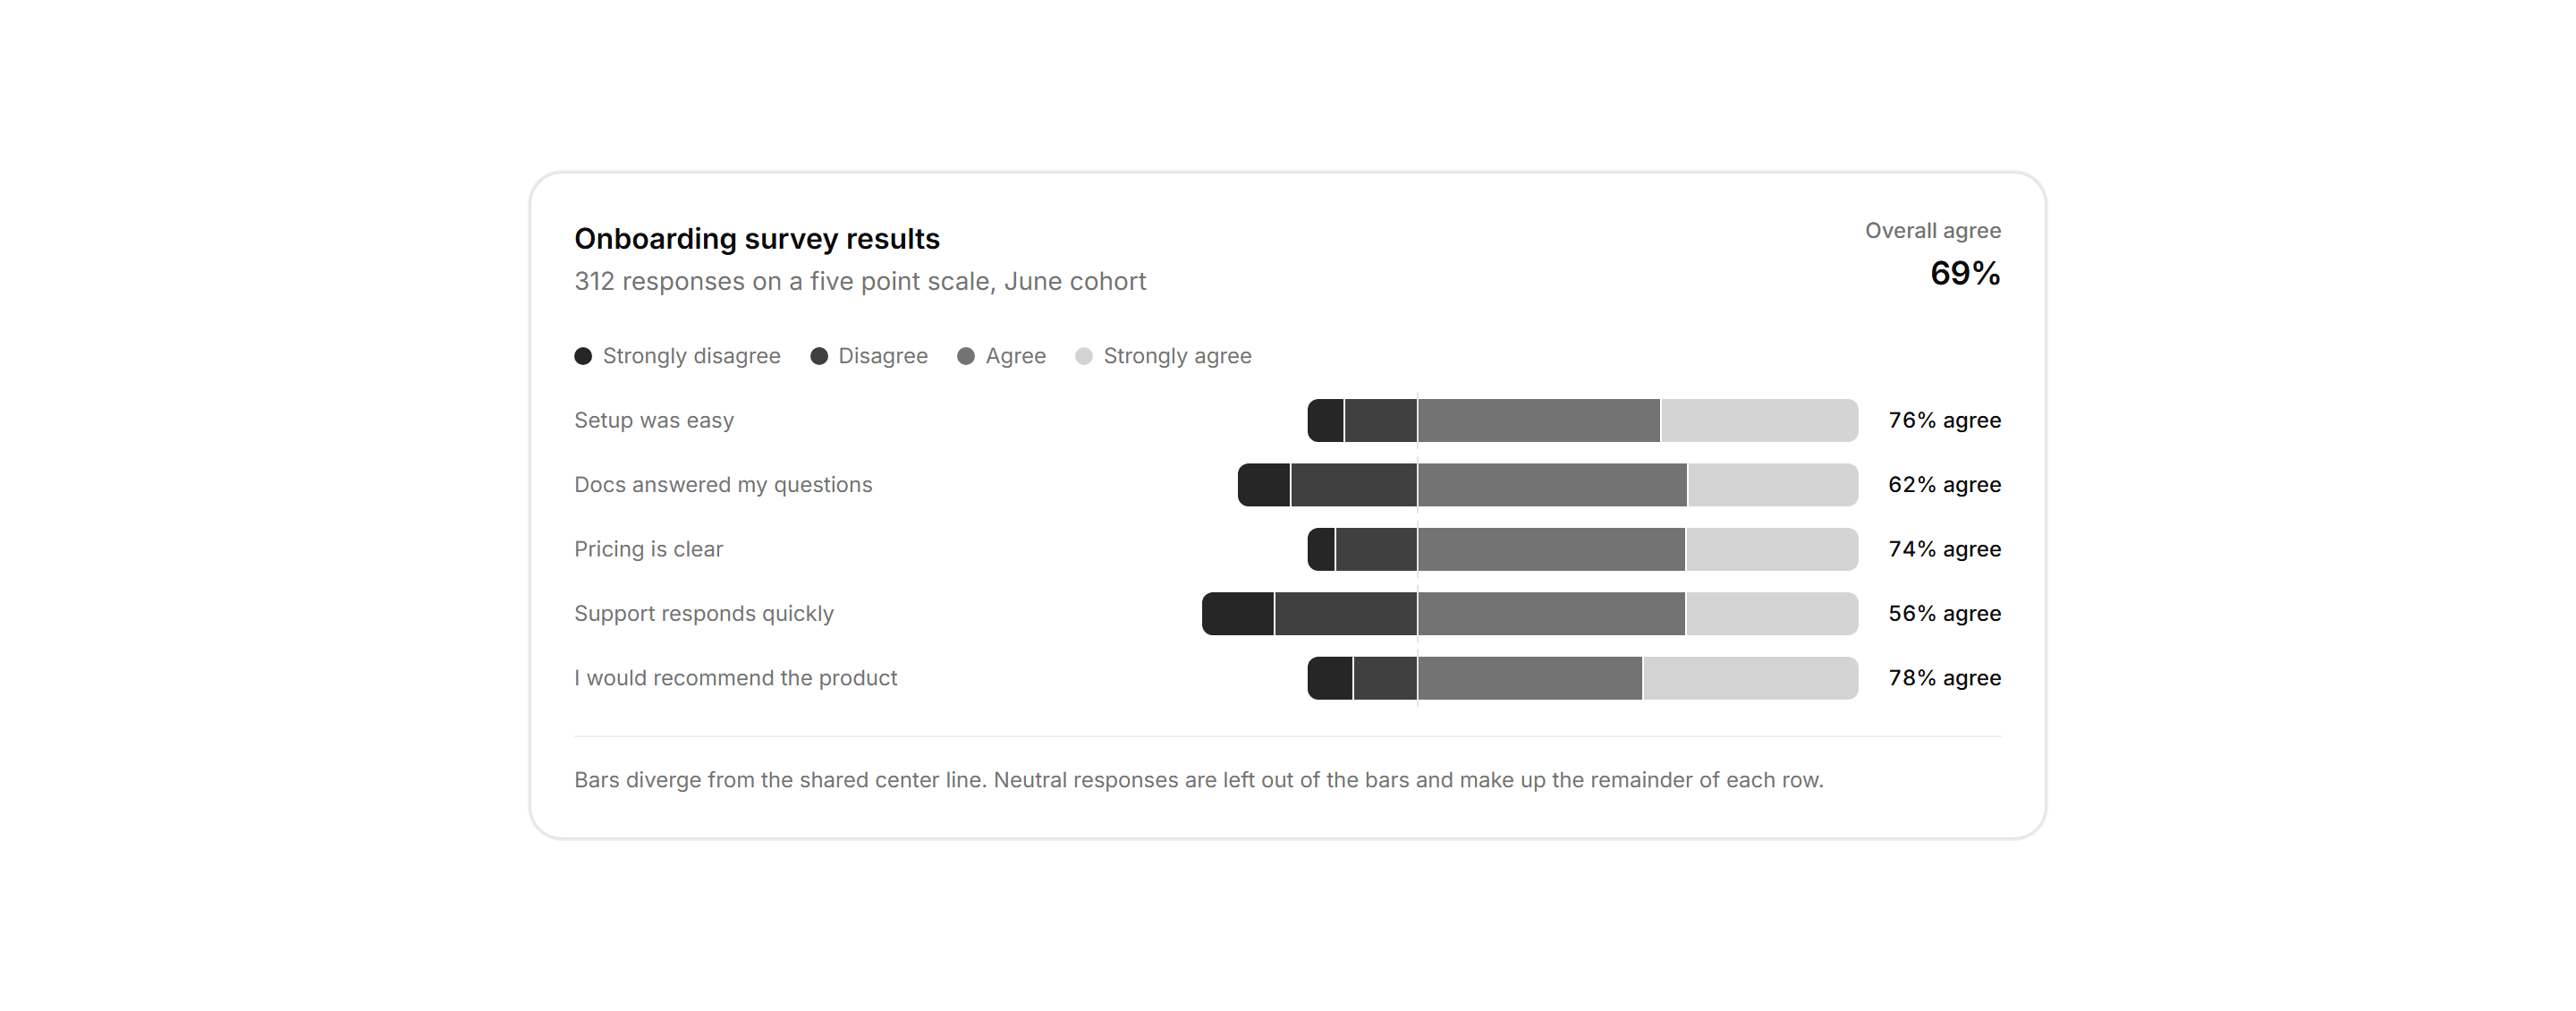

Application Chart: Diverging Survey Bars
Likert survey responses as diverging stacked bars around a center axis with a four segment legend and agree share per question.

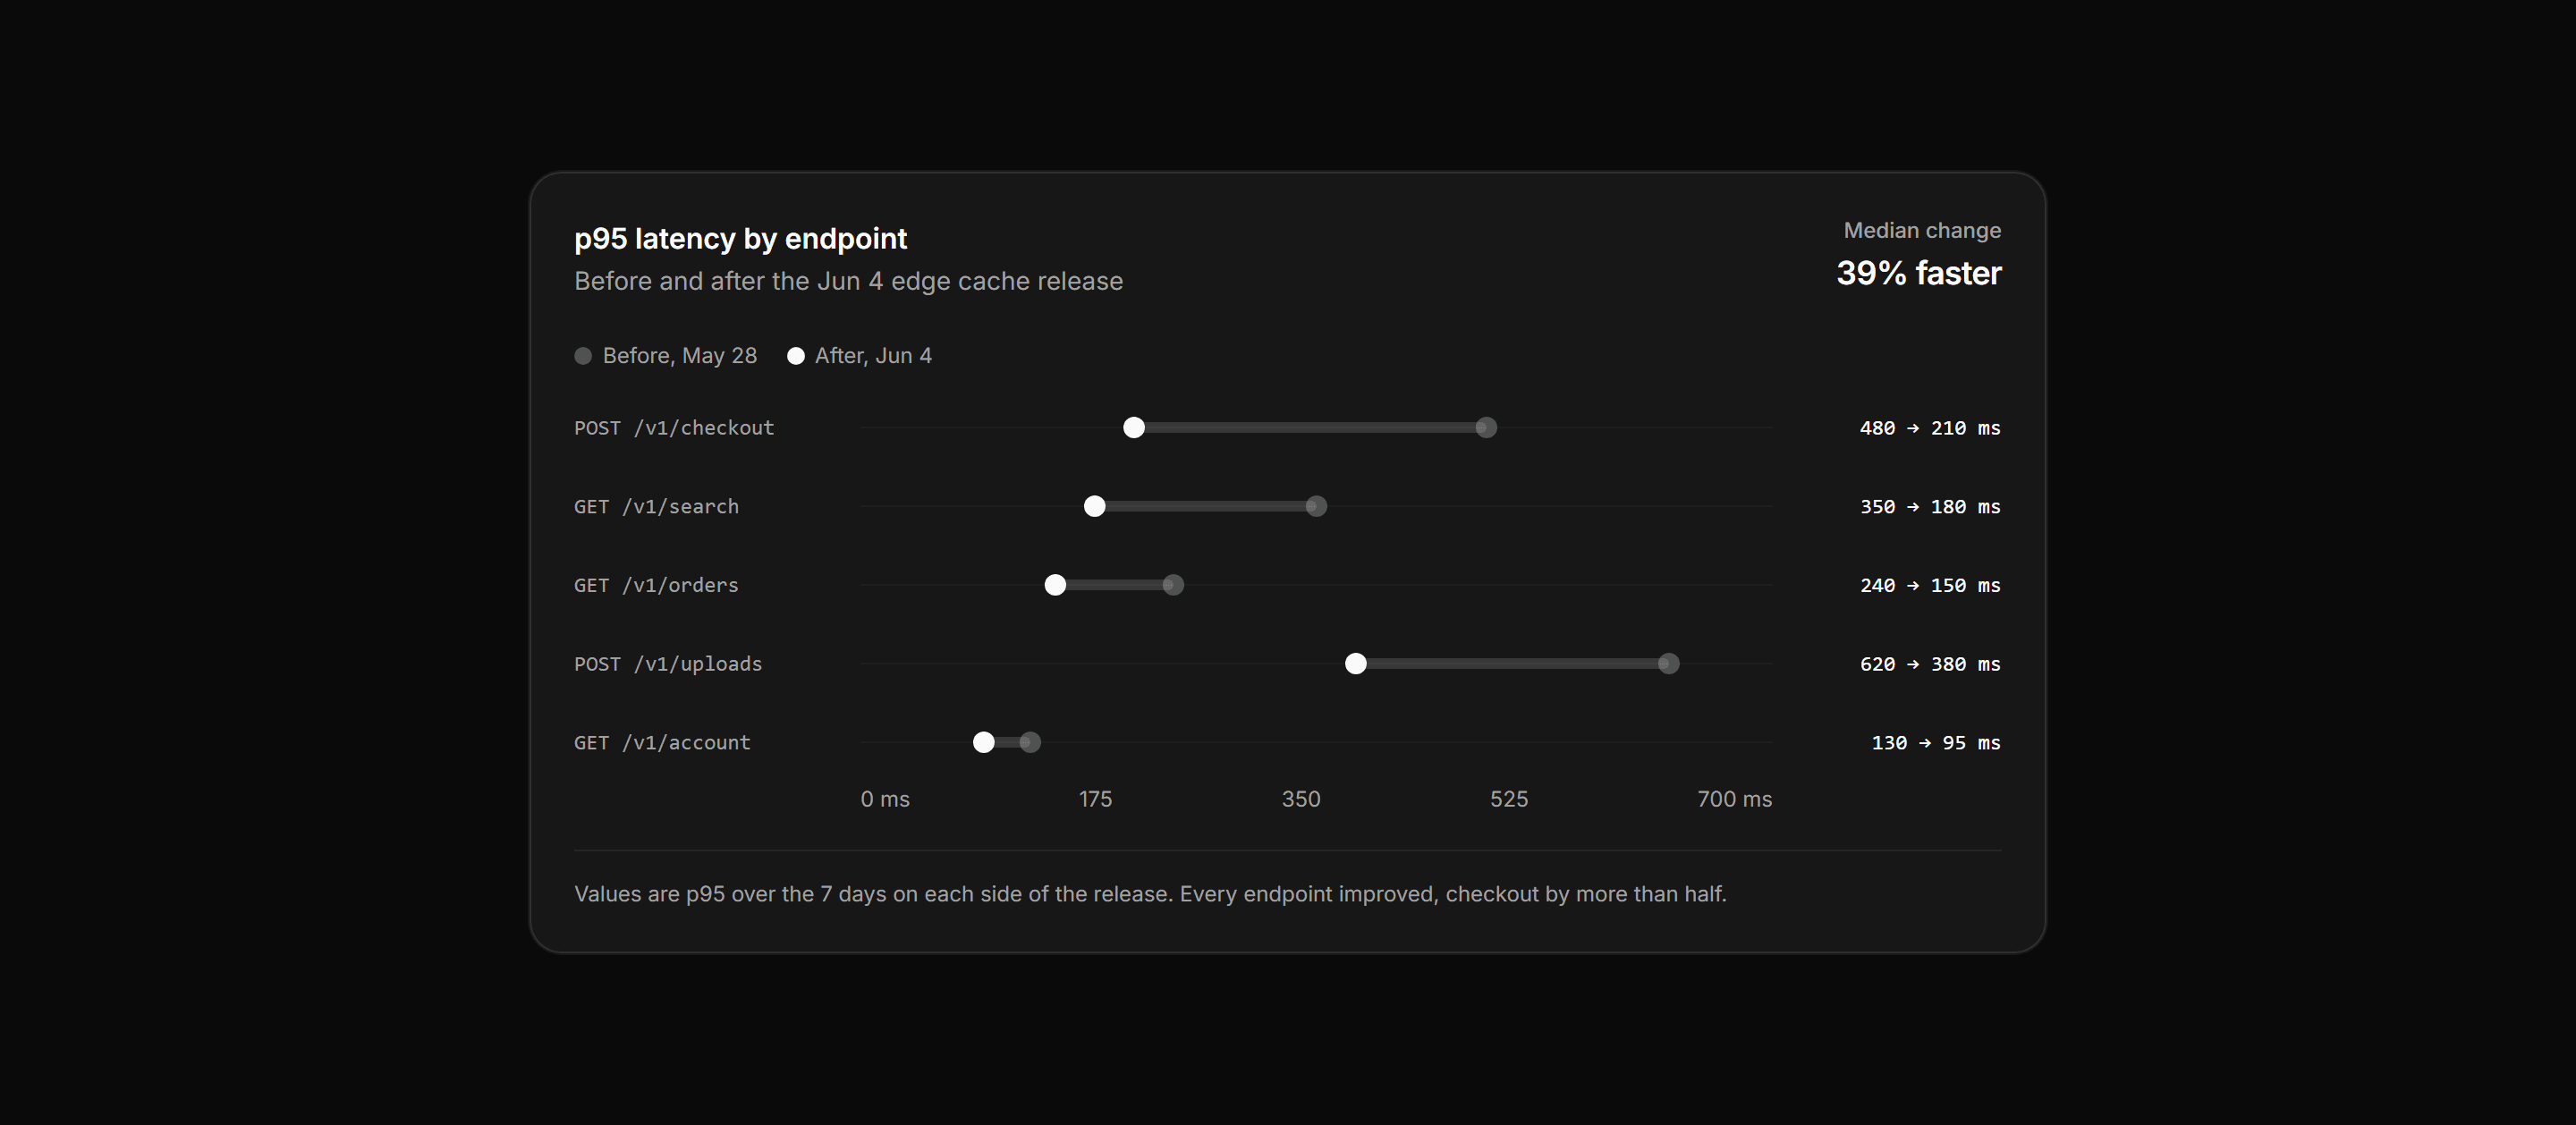
Application Chart: Dumbbell Latency Chart
Dumbbell rows comparing p95 latency per endpoint before and after a release, with connector bars, paired dots, and an axis row.

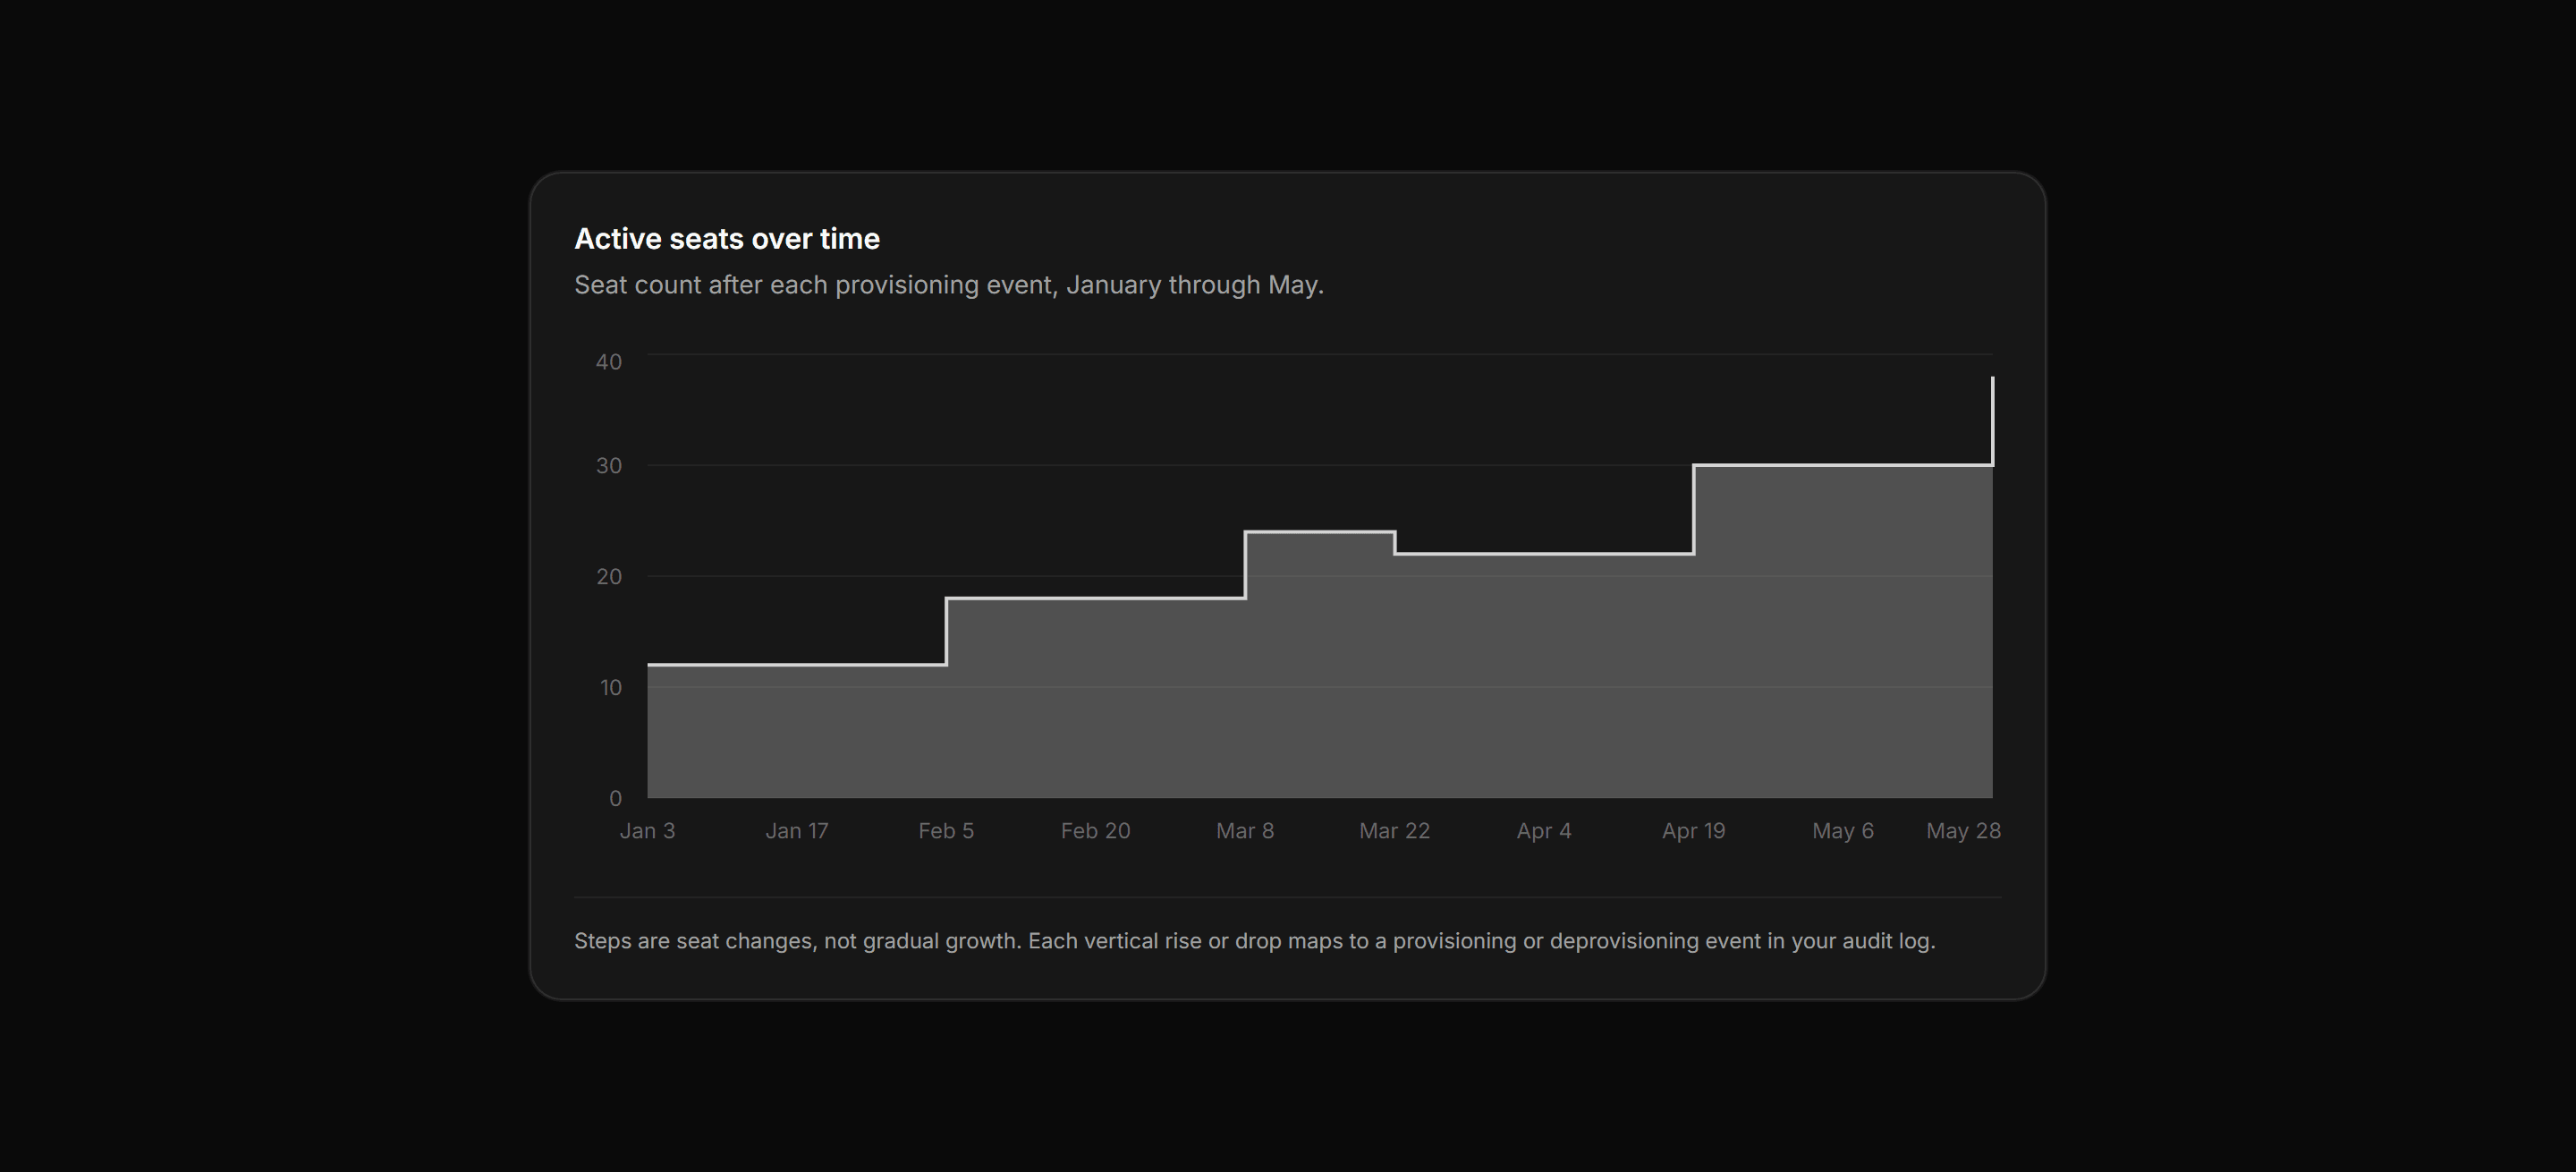
Application Chart: Stepped Area Chart
Active seats area chart using stepAfter type so each provisioning event reads as an instantaneous jump, not gradual growth.
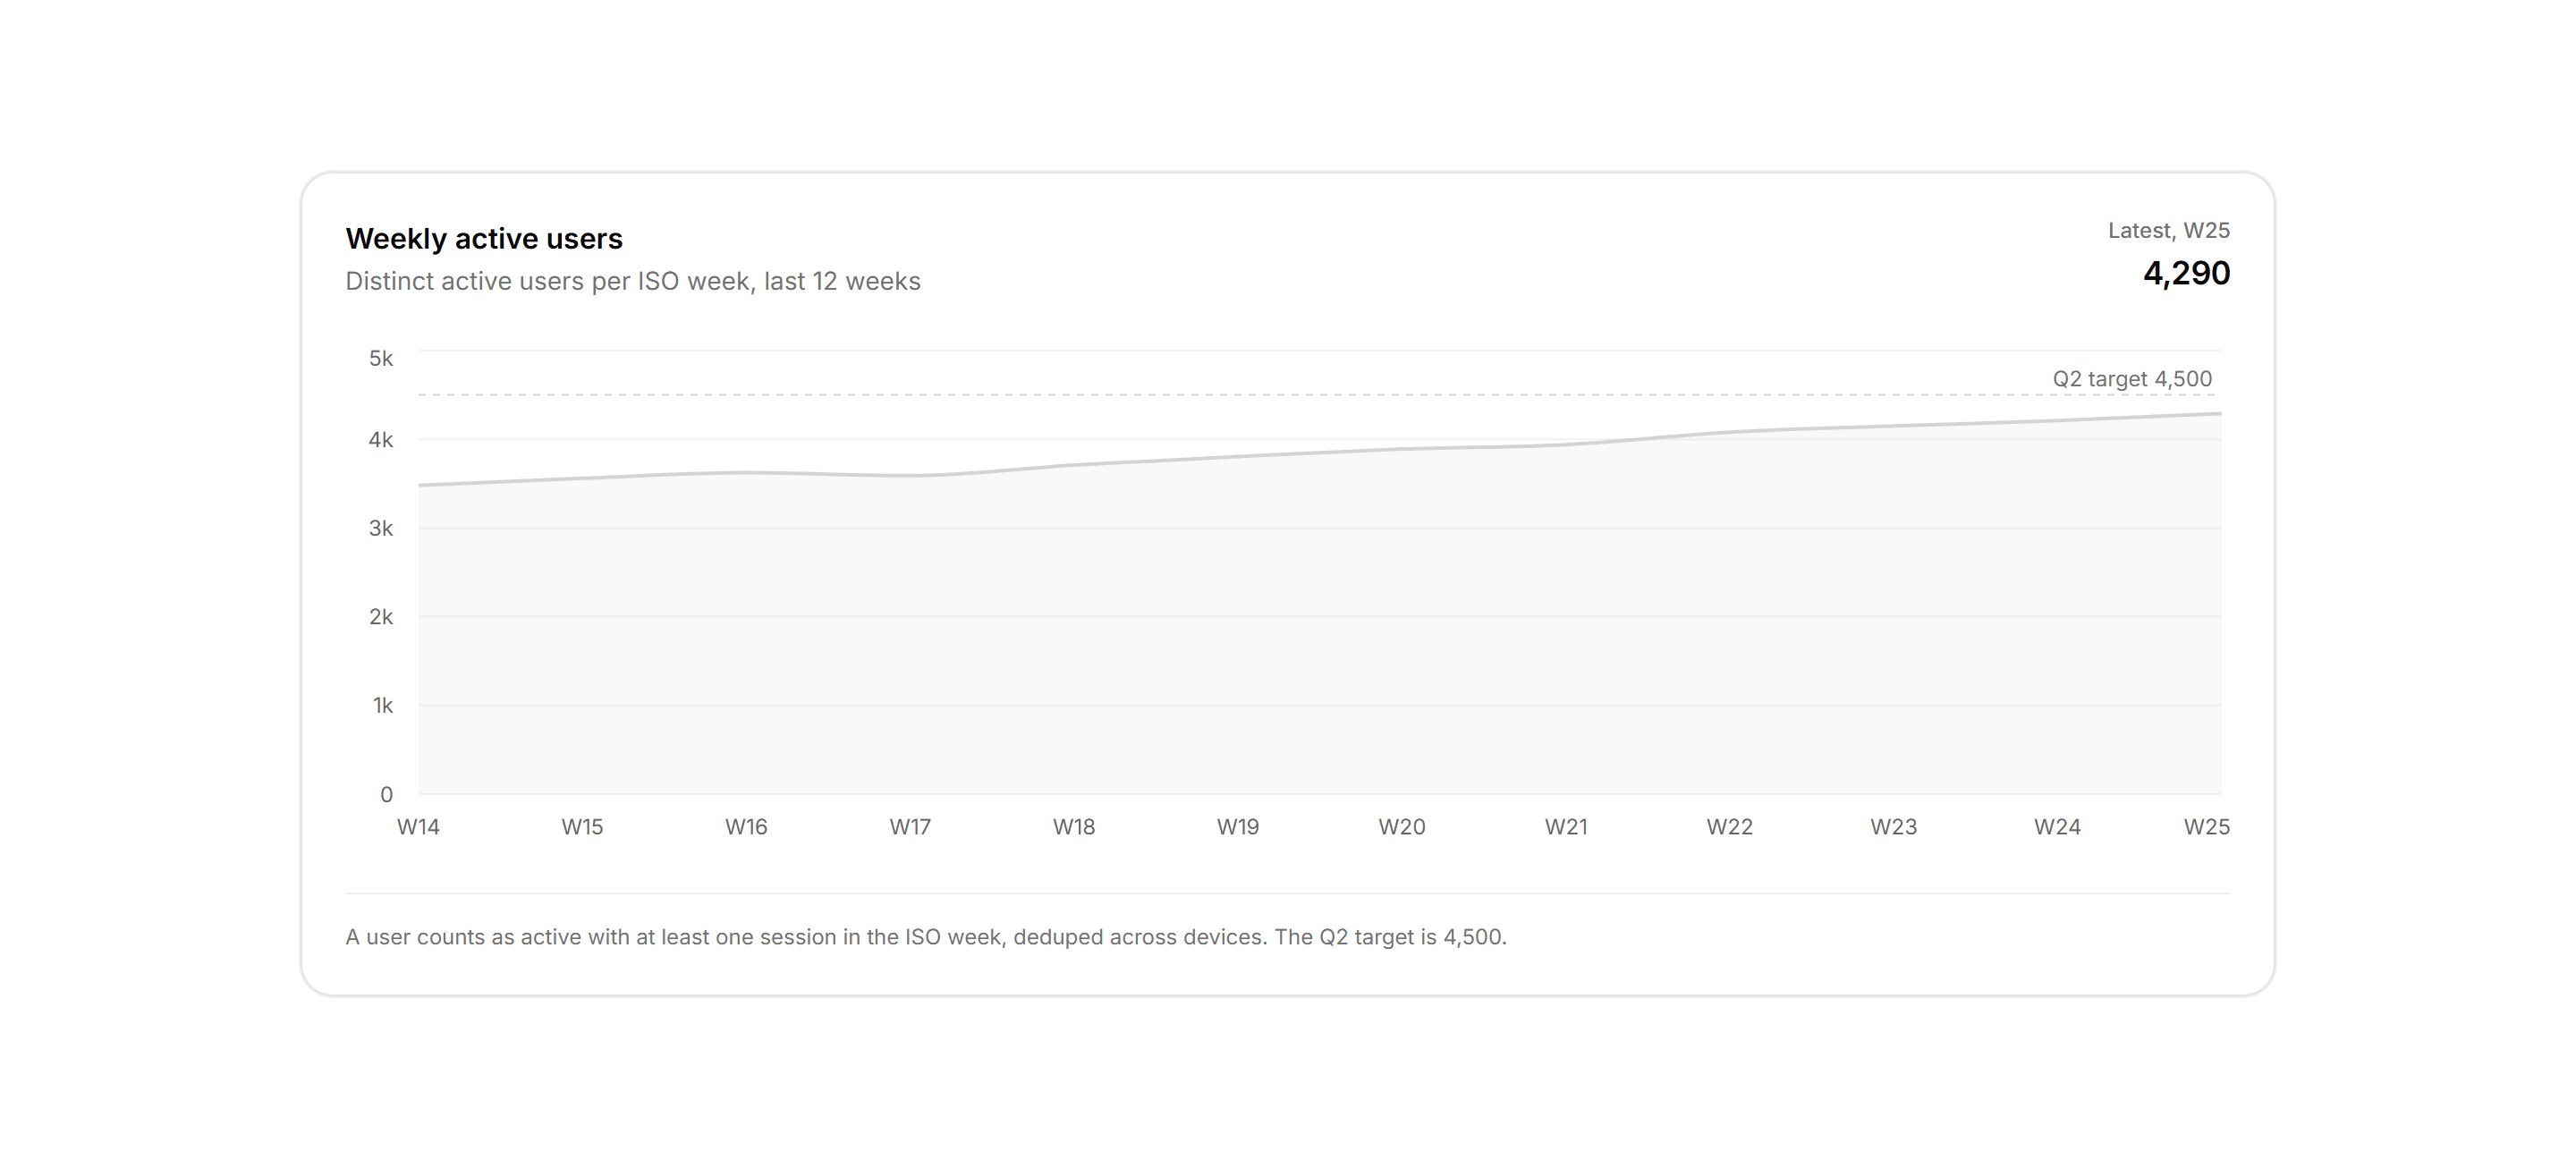
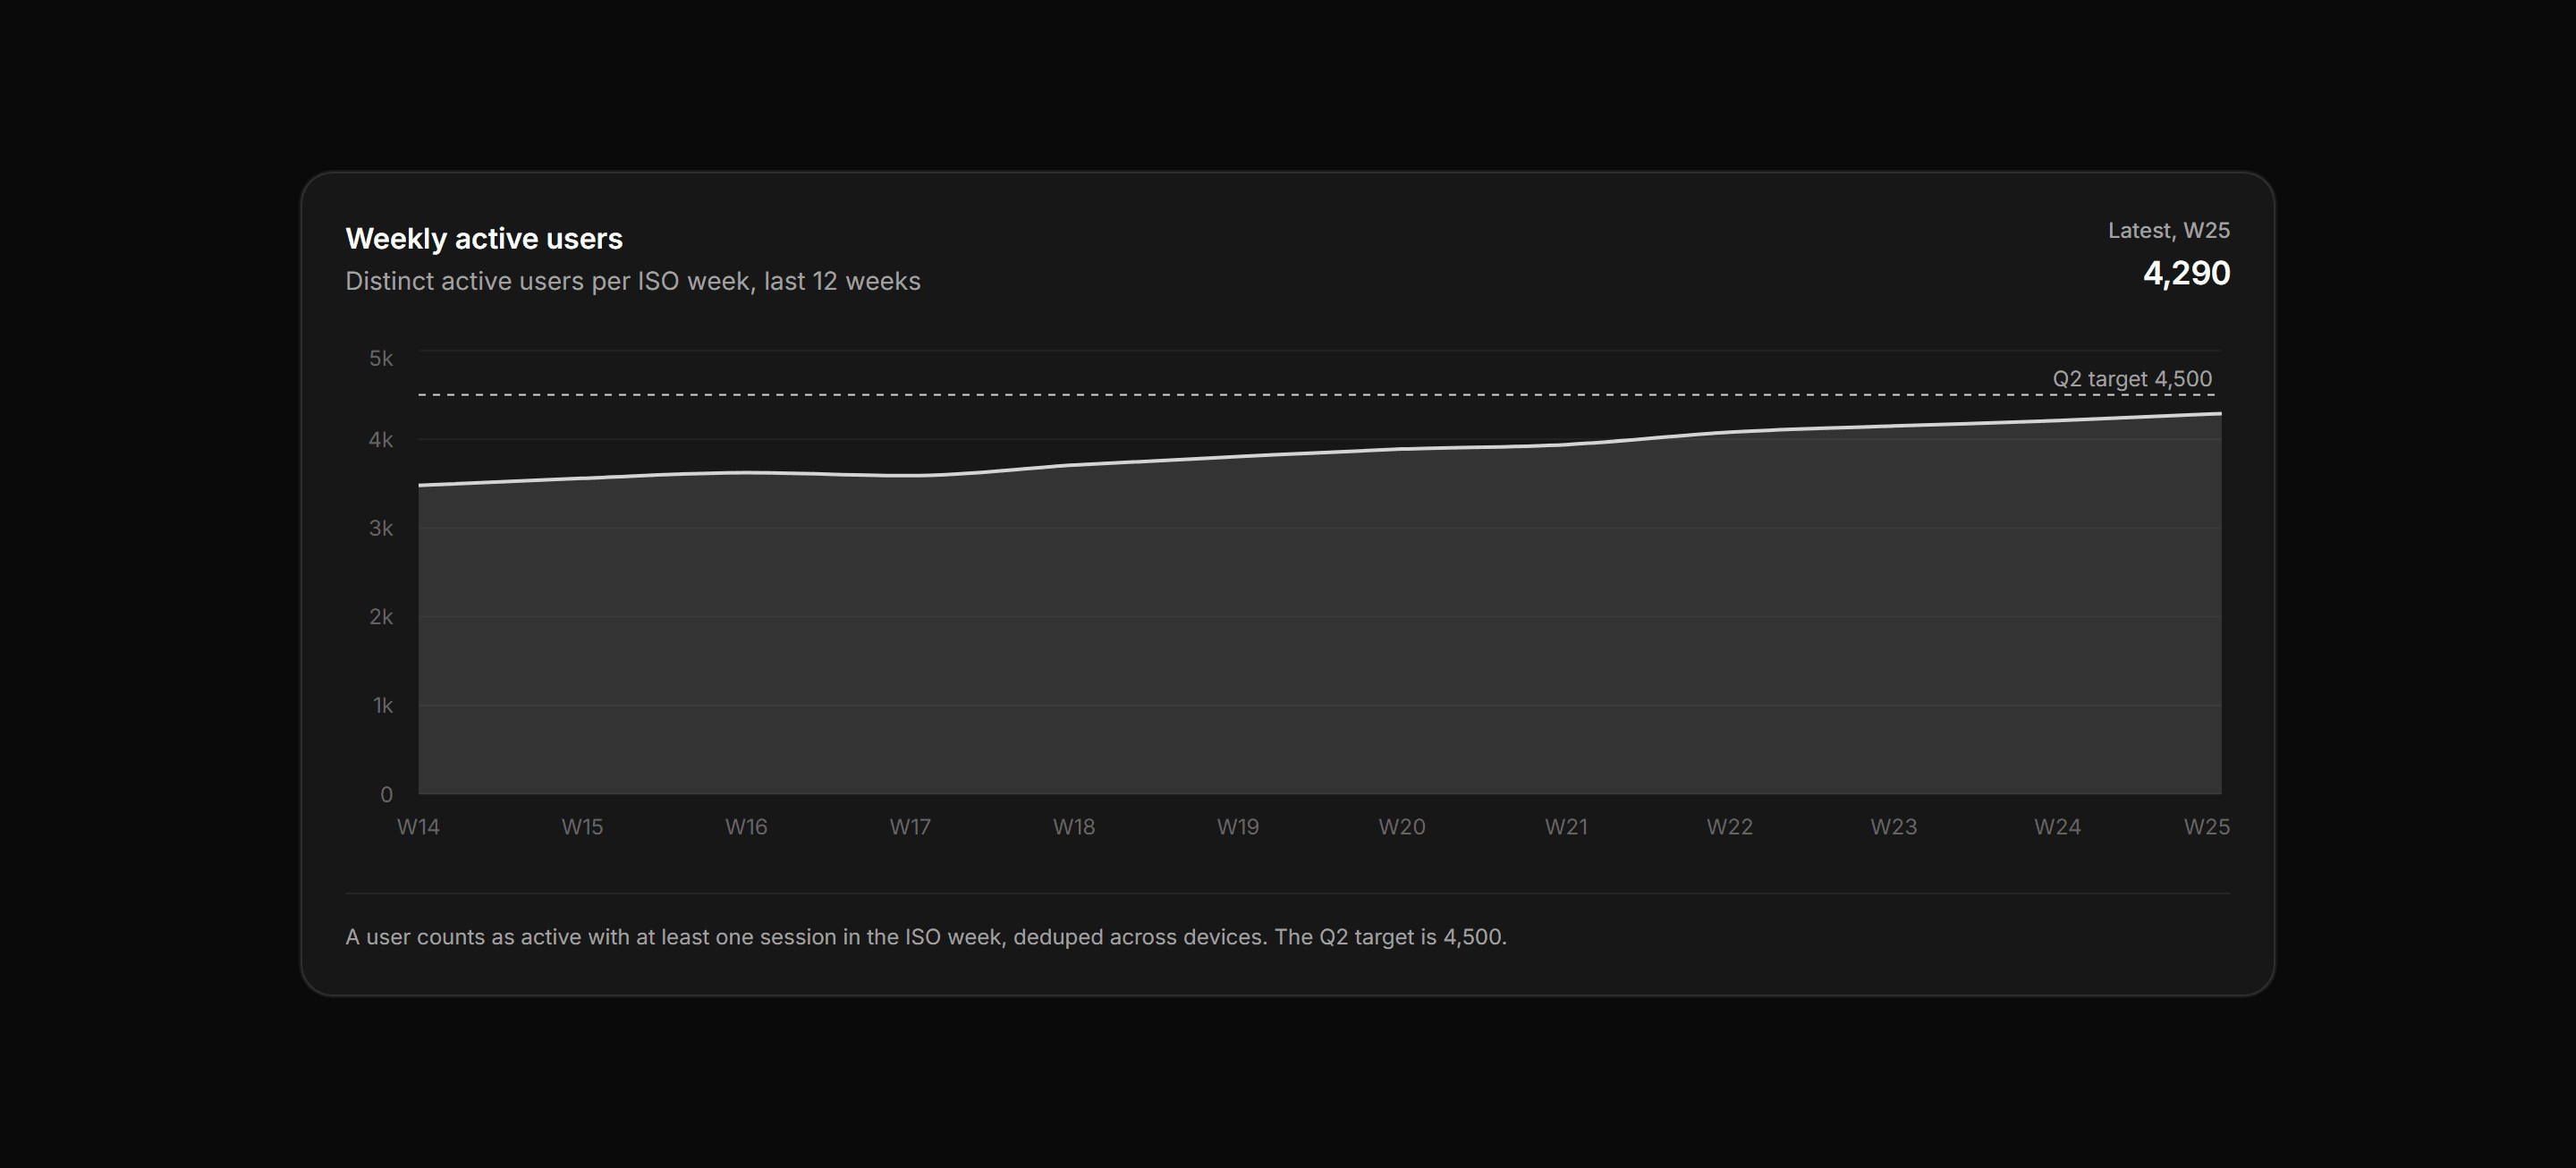
Application Chart: Weekly Active Users Chart
Distinct active users per ISO week as a filled area over 12 weeks with a dashed quarter target reference line.


Application Chart: Radar Chart
RadarChart comparing two plans across five feature dimensions with filled polygons and a shared legend.

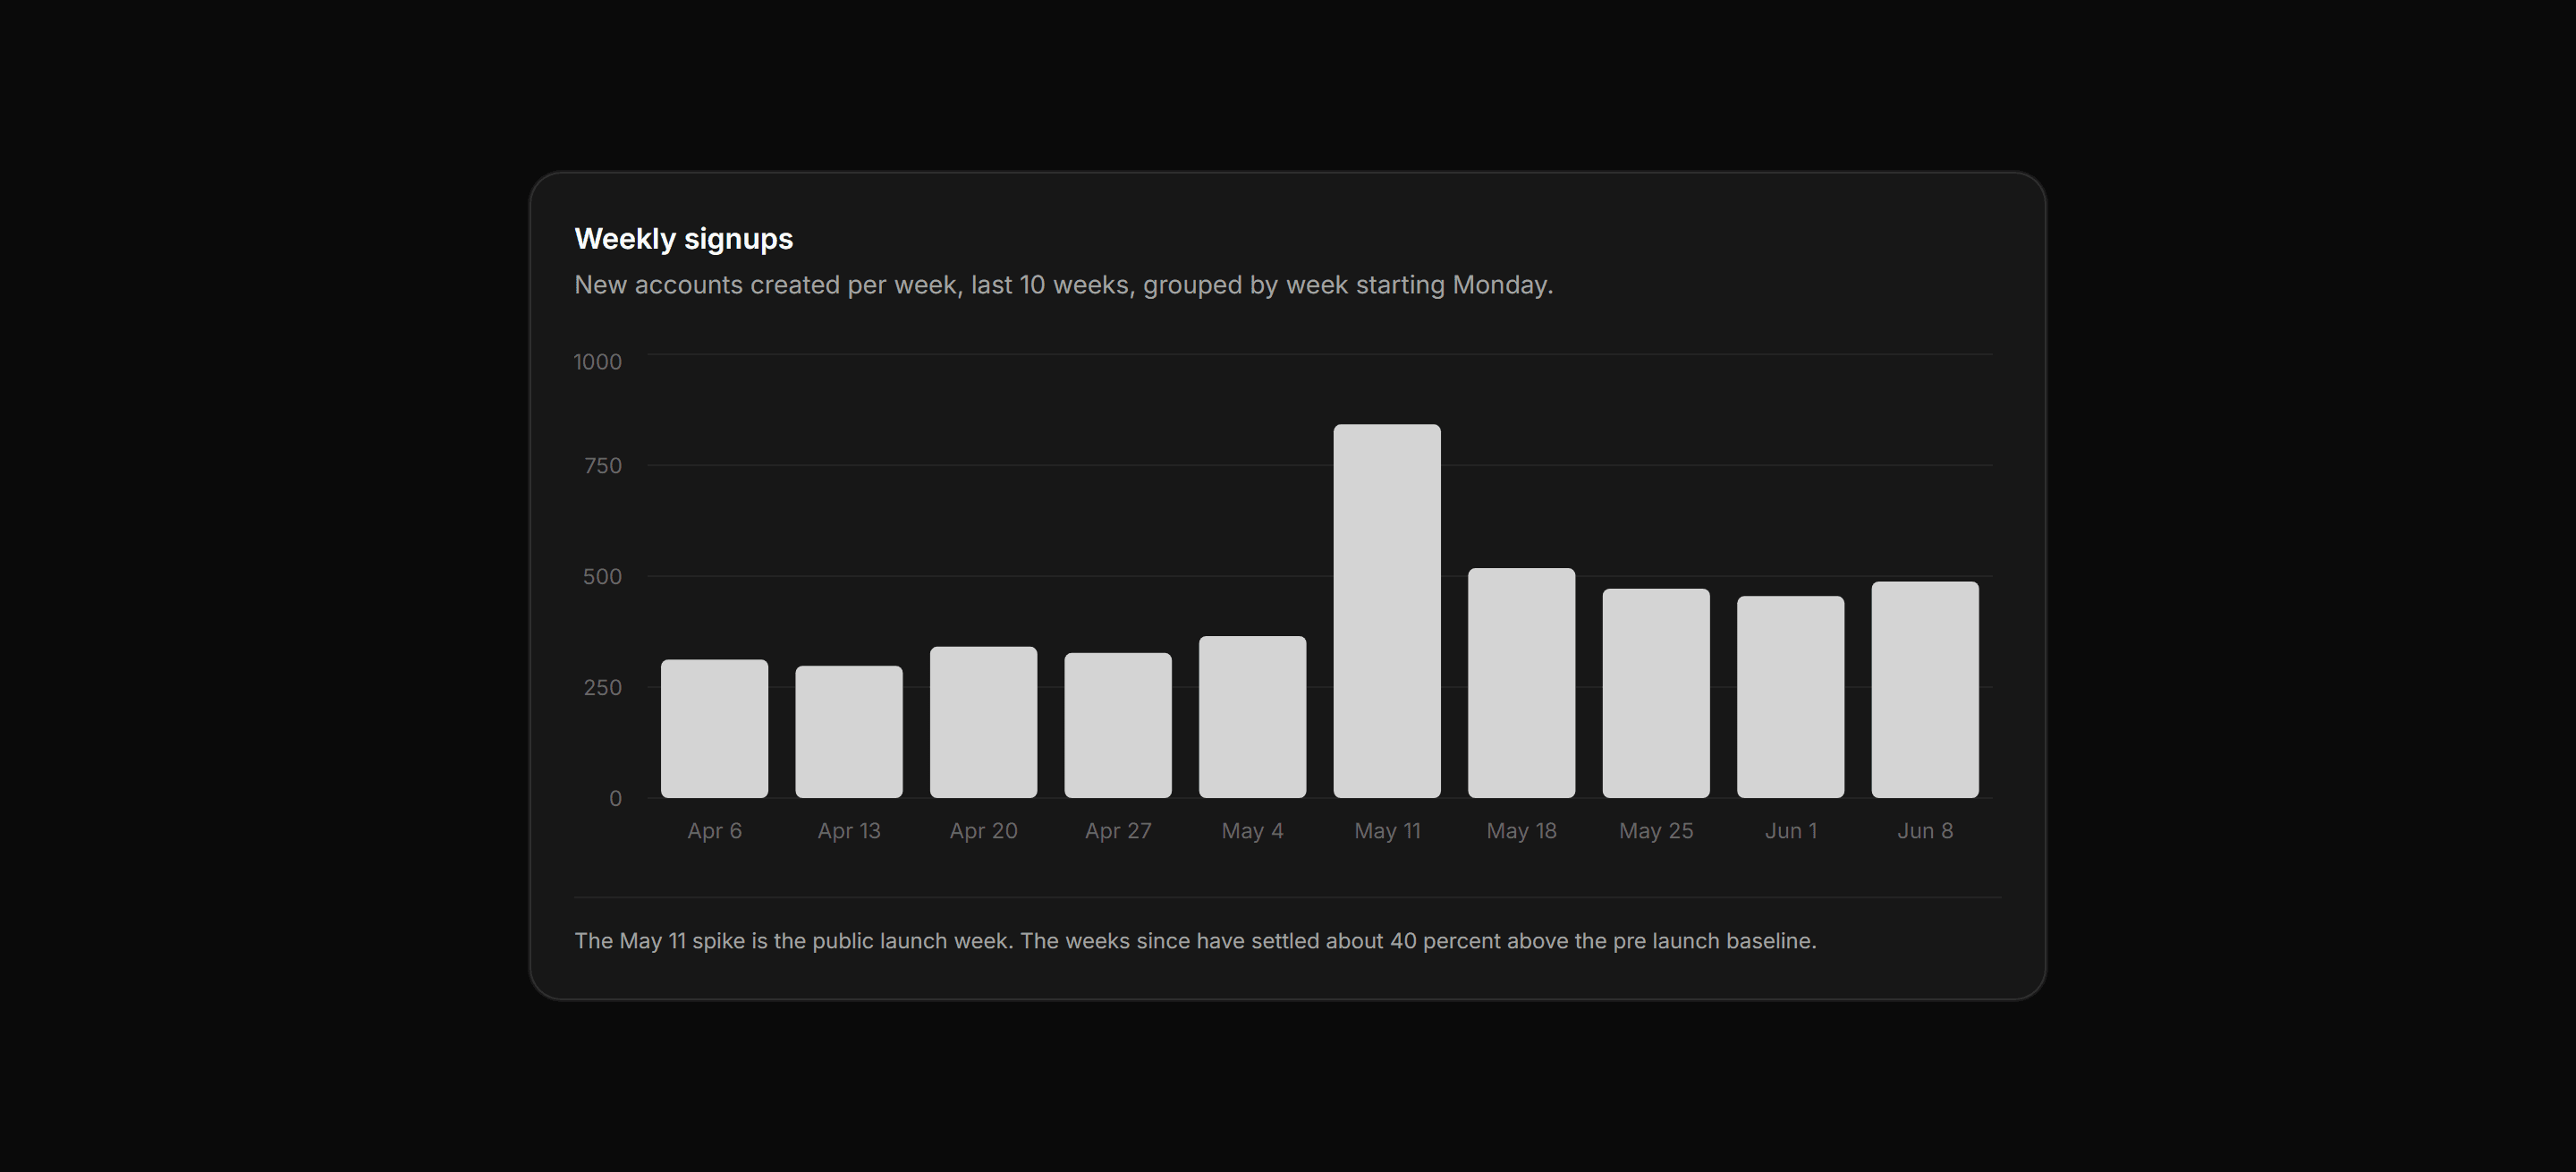
Application Chart: Signups Bar Chart
Weekly new account signups as a single series bar chart over 10 weeks with a labeled launch spike.

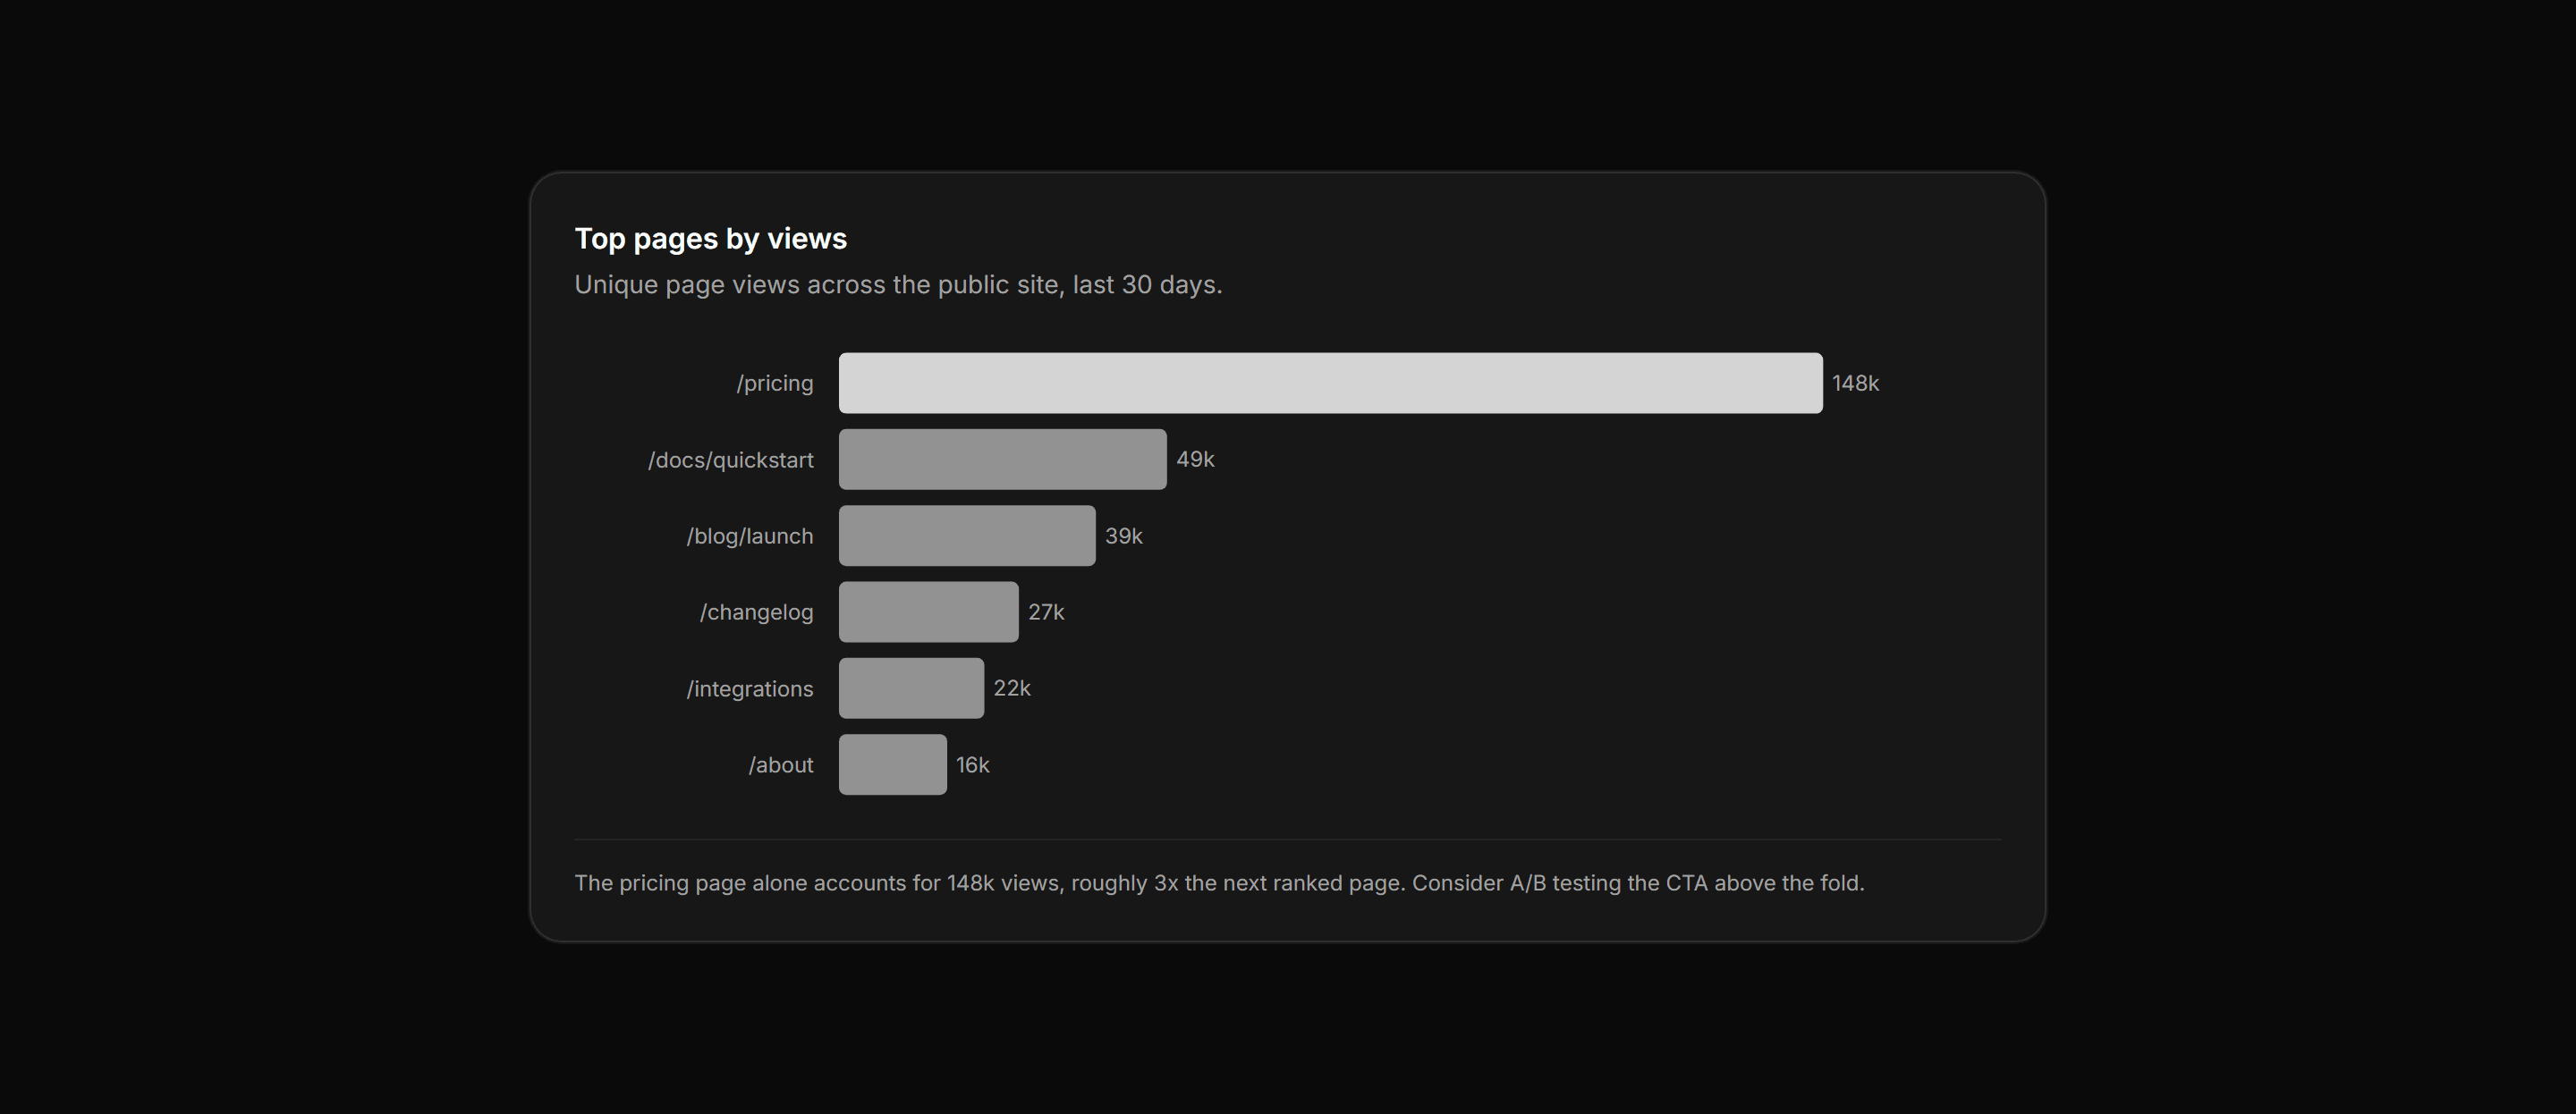
Application Chart: Horizontal Bar Ranking
Horizontal bar chart ranking the top 6 pages by view count with inline value labels and a footnote naming the 3x lead of the top page.
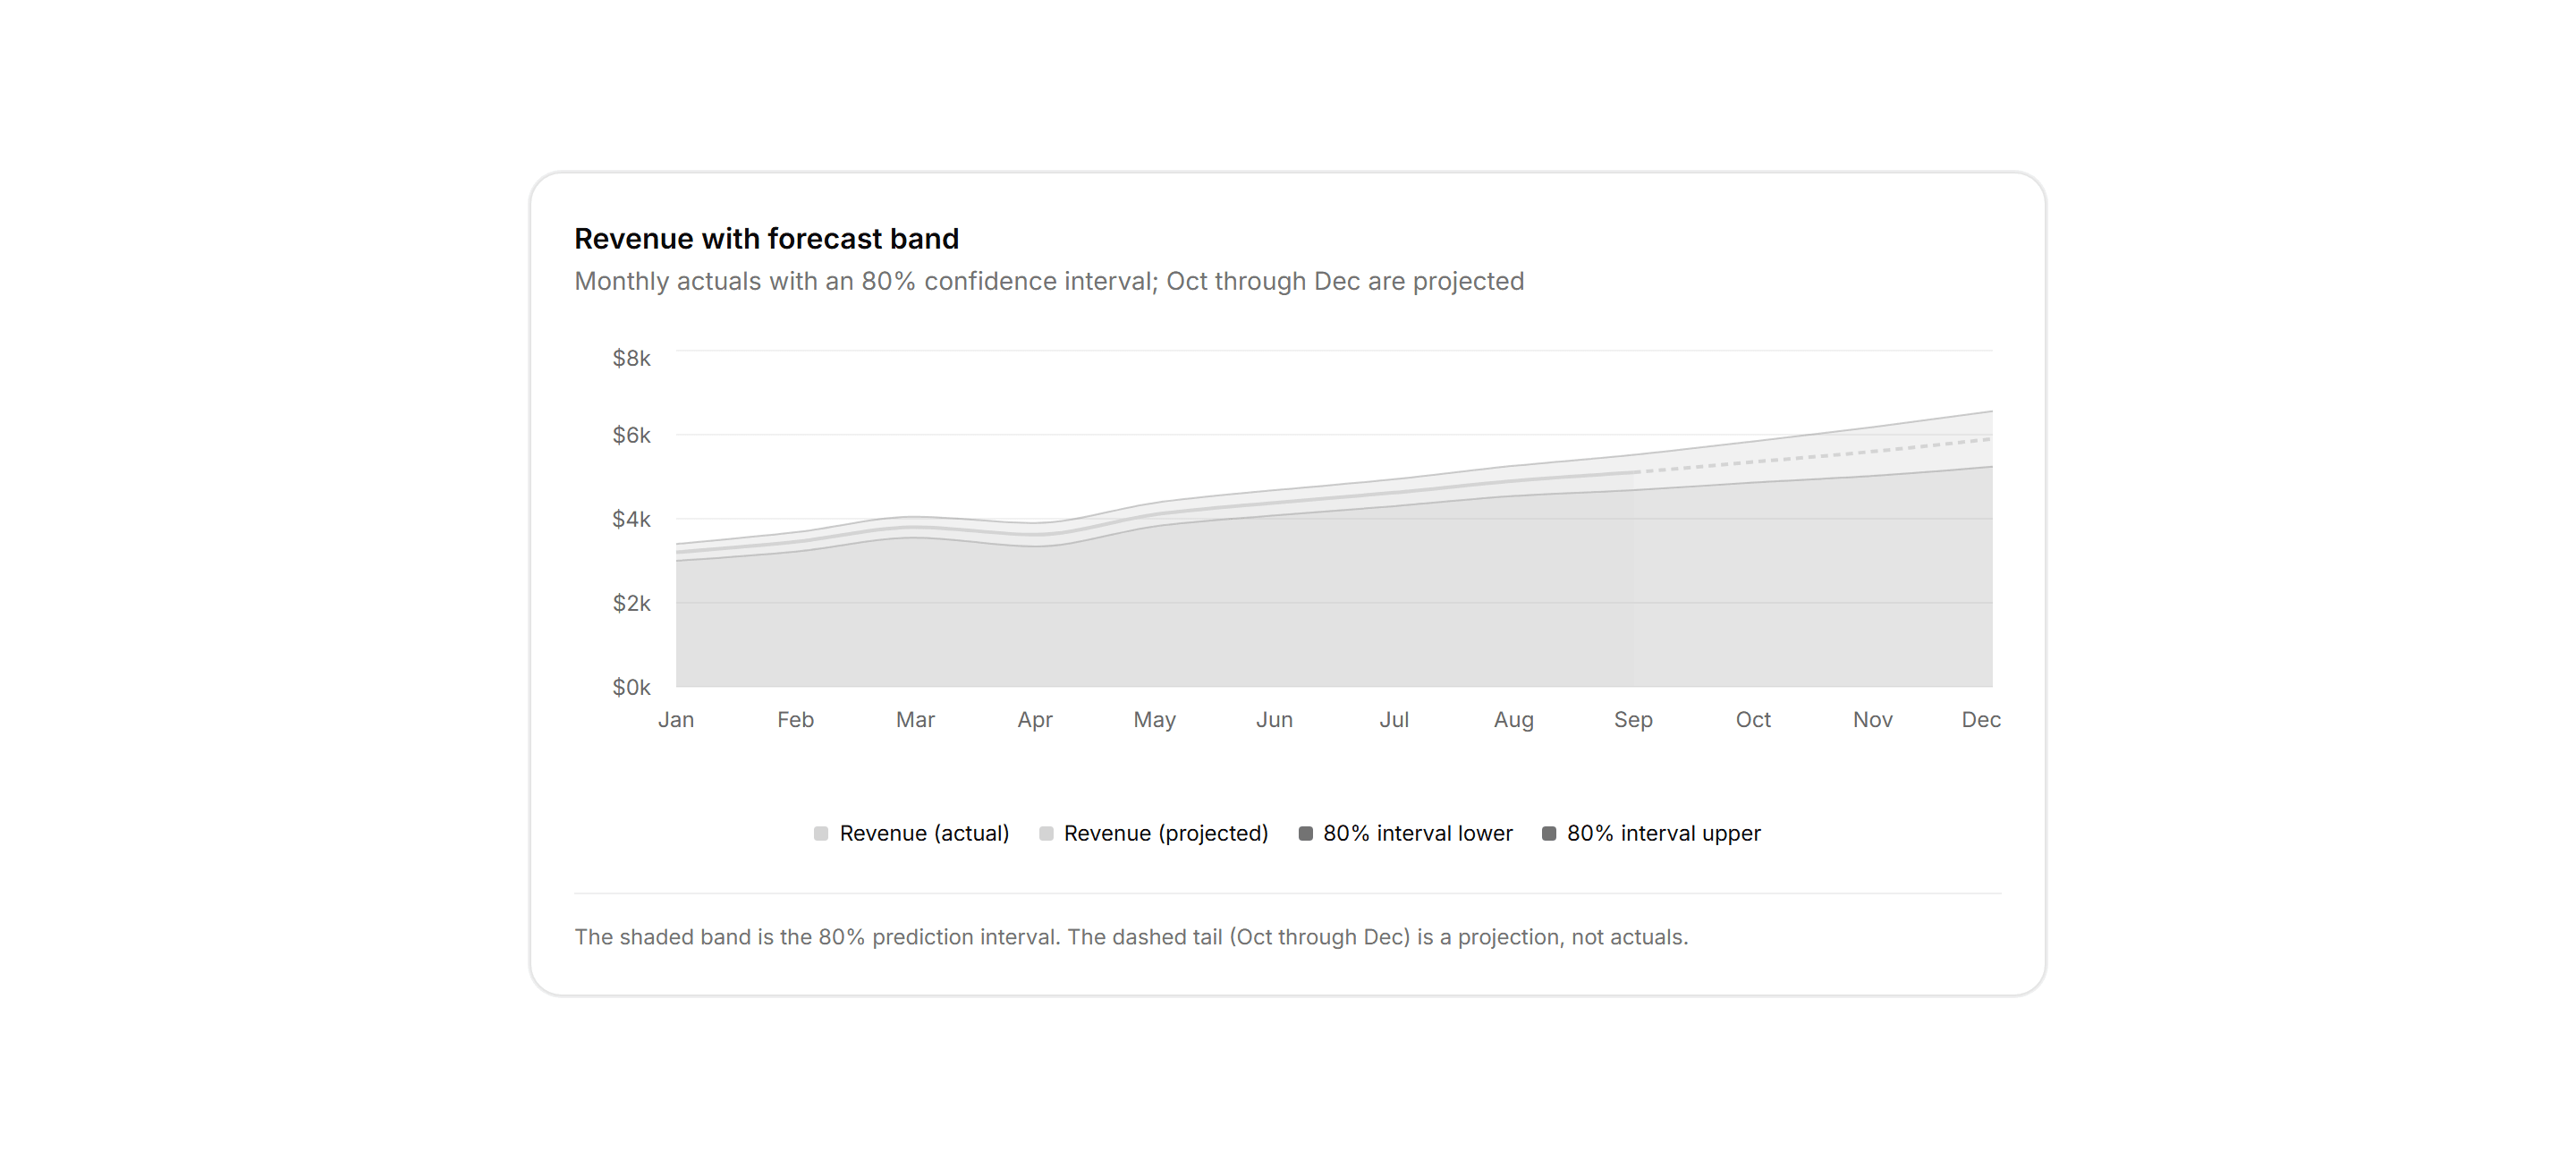

Application Chart: Area With Range Chart
An area chart showing actuals with a muted 80% confidence band and a dashed projection tail for future months.
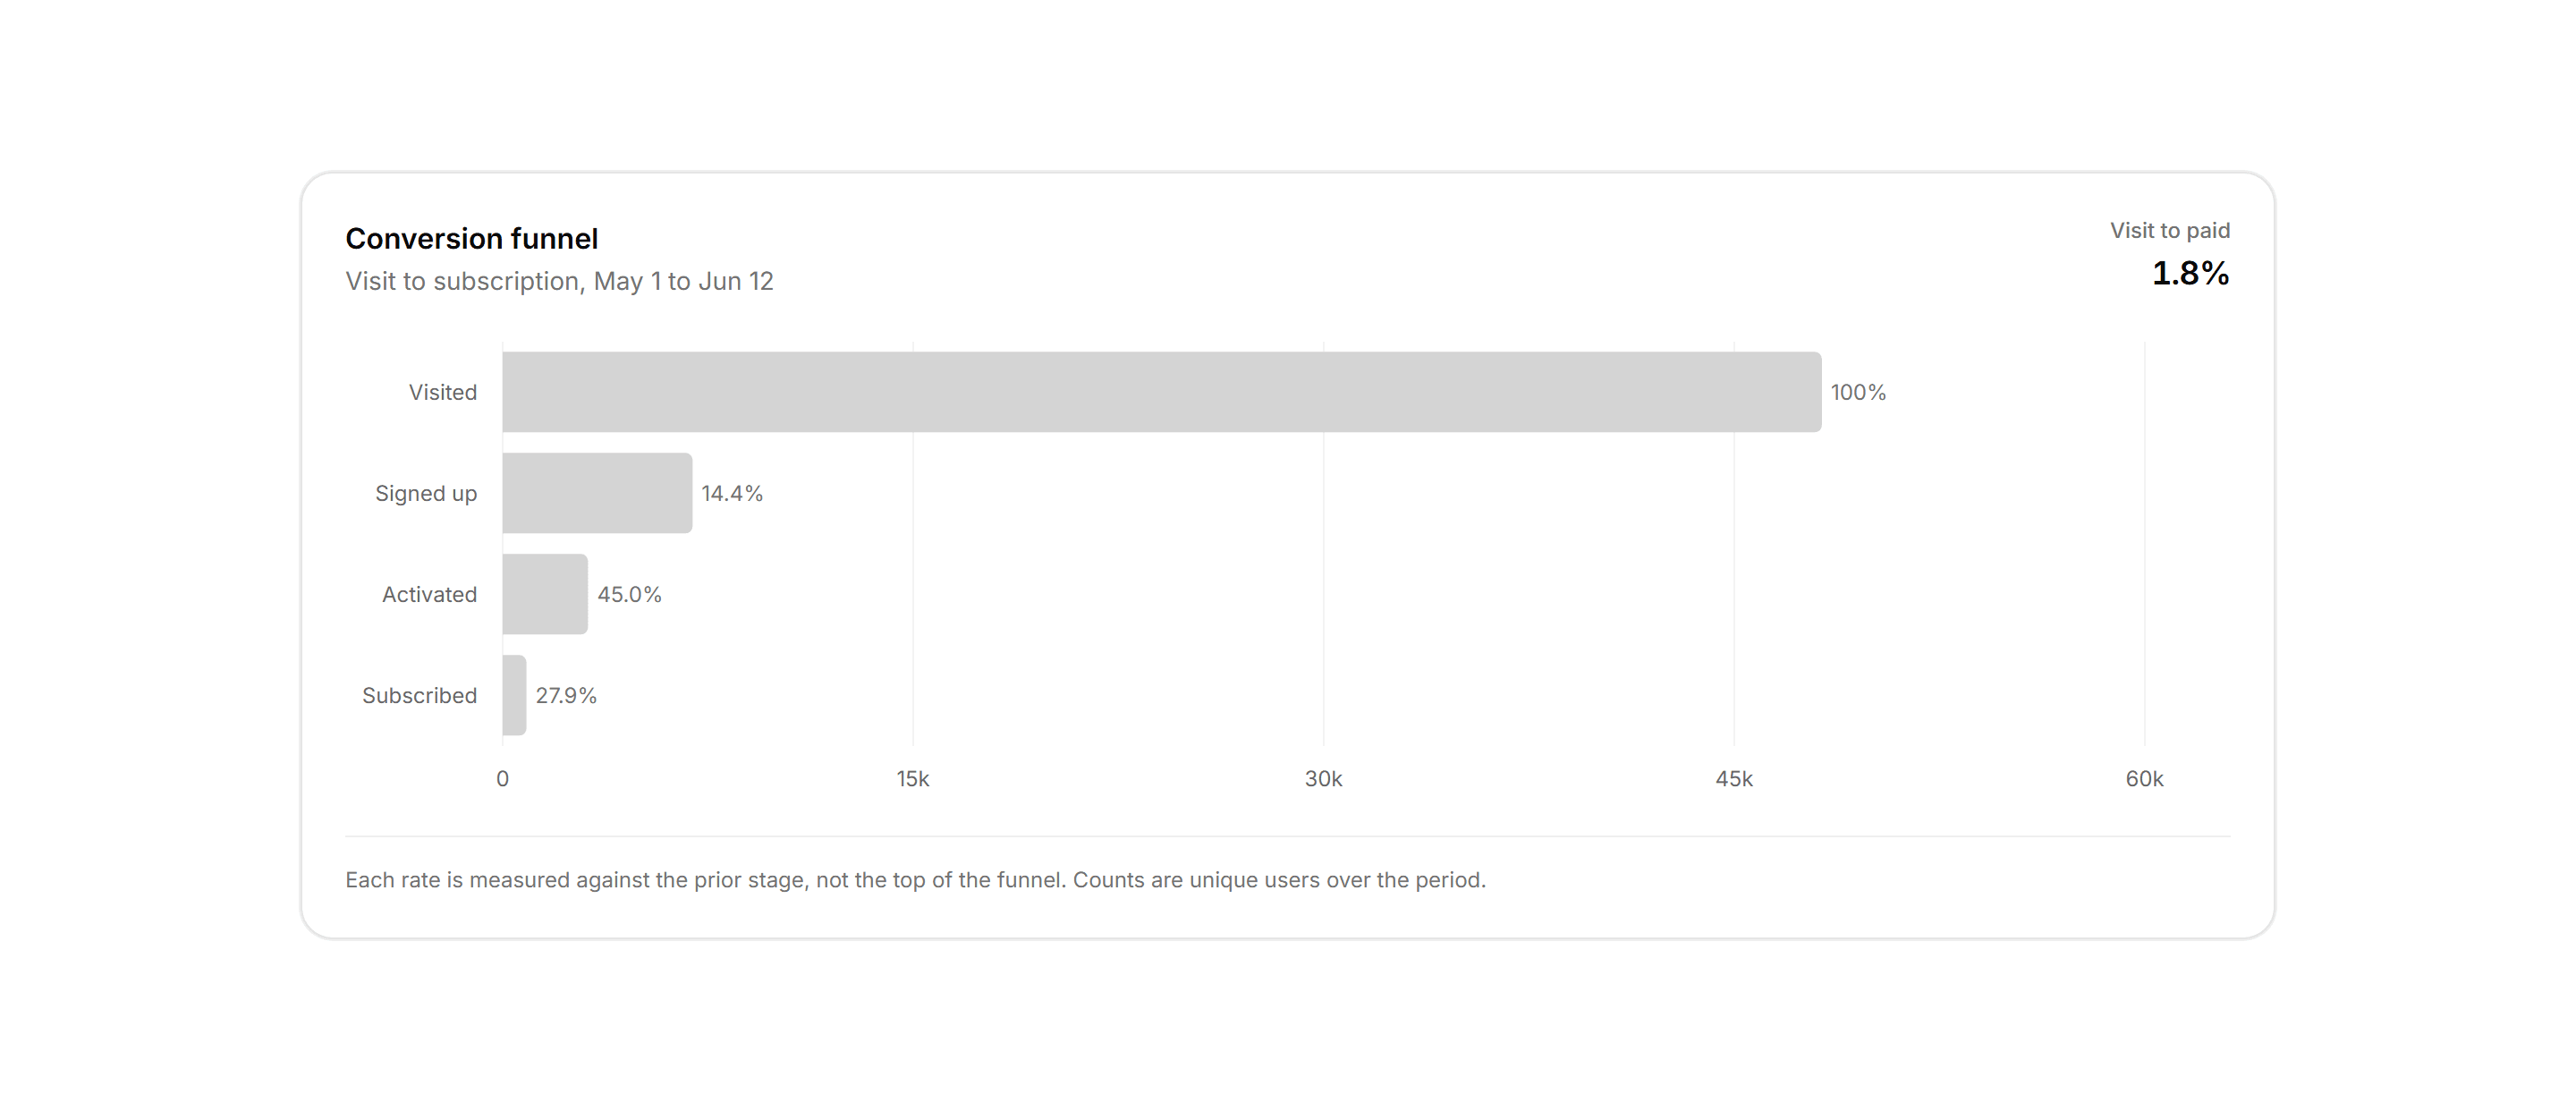

Application Chart: Conversion Funnel Bars
The funnel as horizontal bars with each rate against the prior stage, labeled.