Shadcn Status and Health Blocks
Browse 14 Application Pro status blocks for shadcn/ui. Status pages, incident timelines, uptime grids, and maintenance windows.
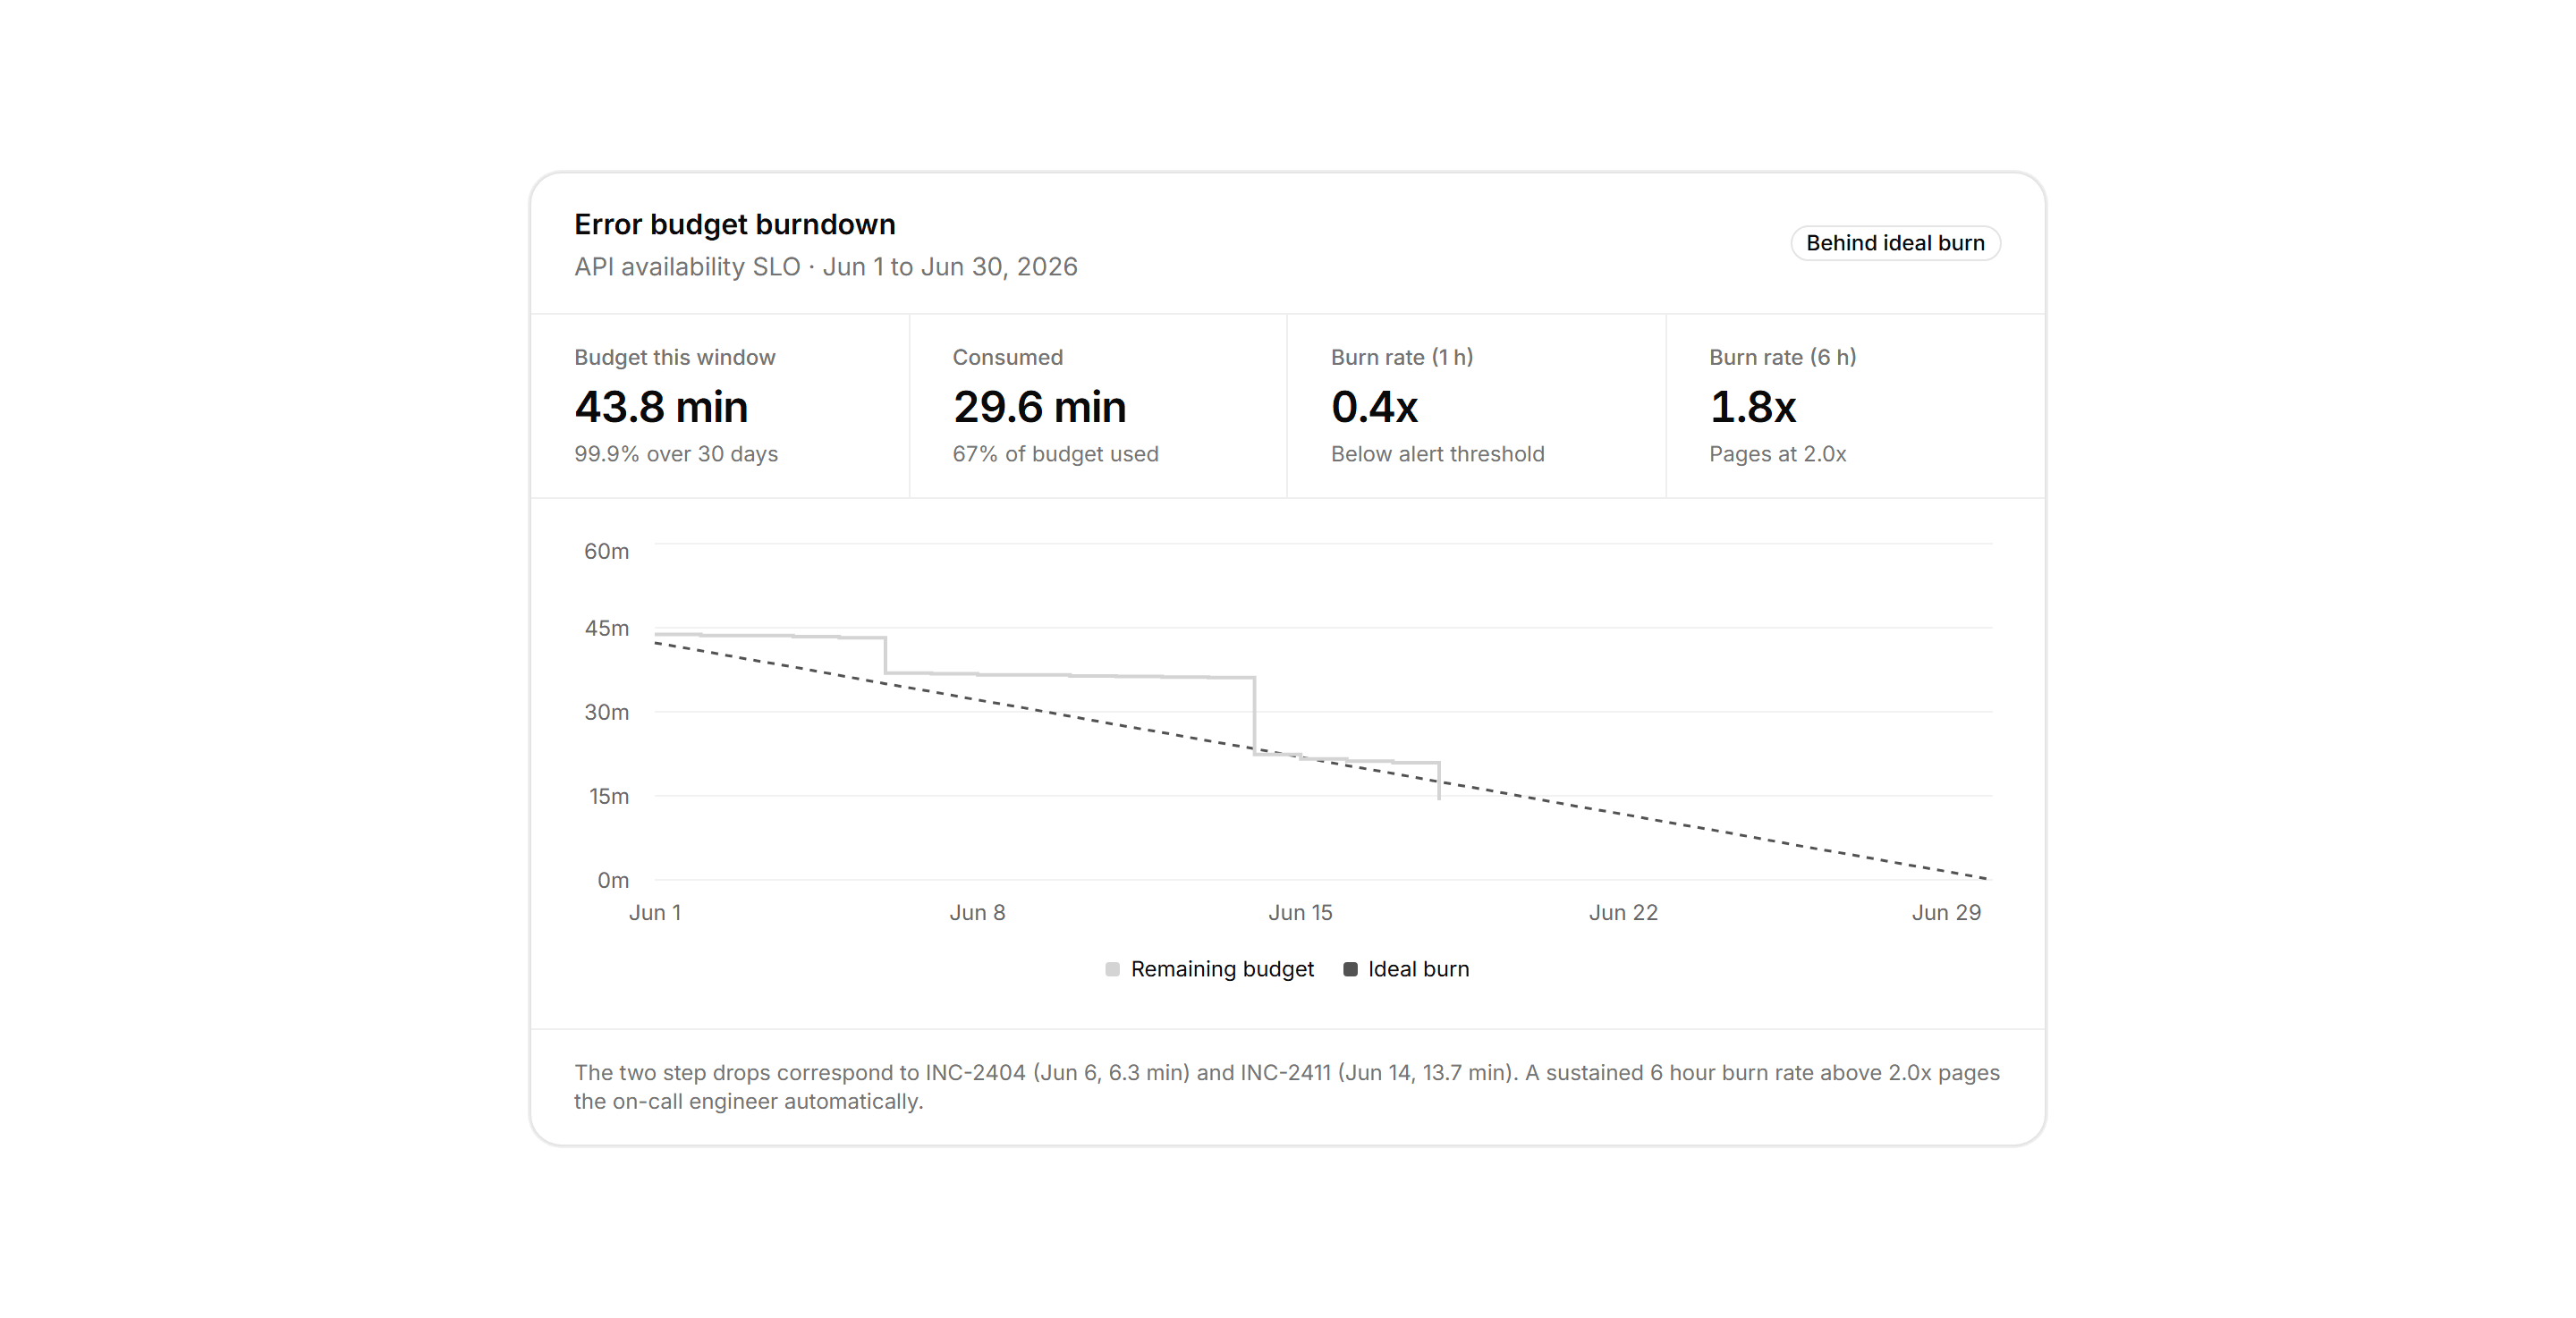
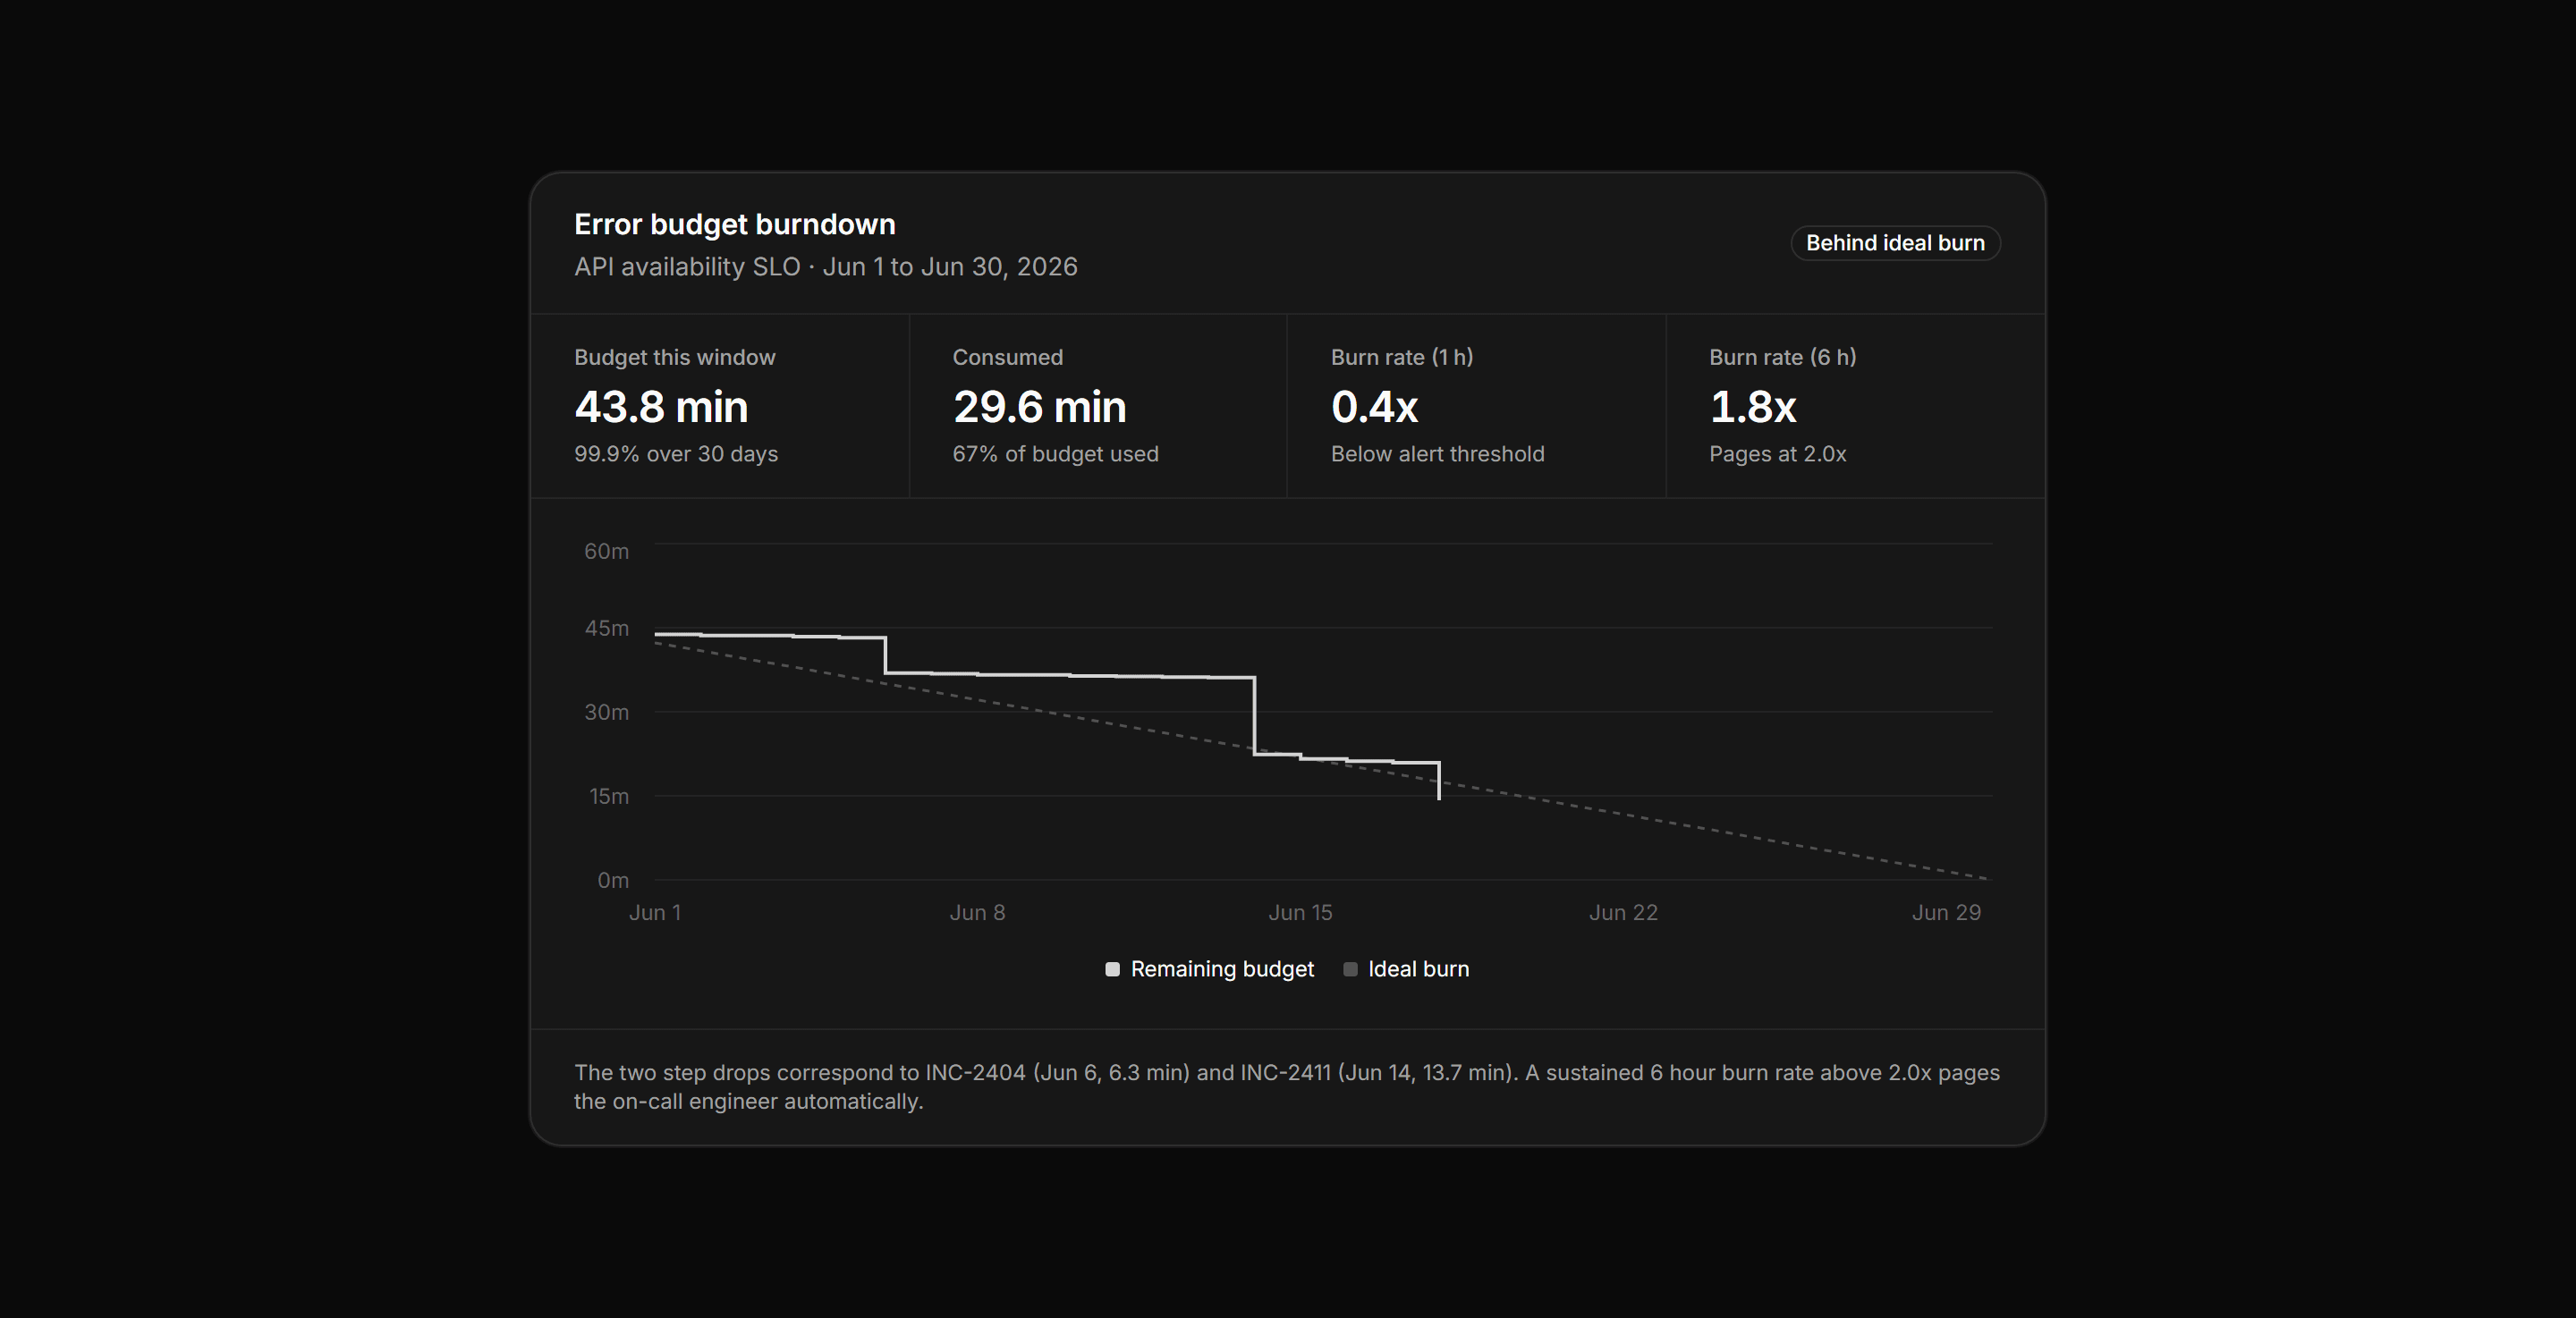
Application Status and Health: Error Budget Burndown
An SLO panel with a header badge, a four stat budget and burn rate row, and a line chart tracking remaining budget against ideal burn.
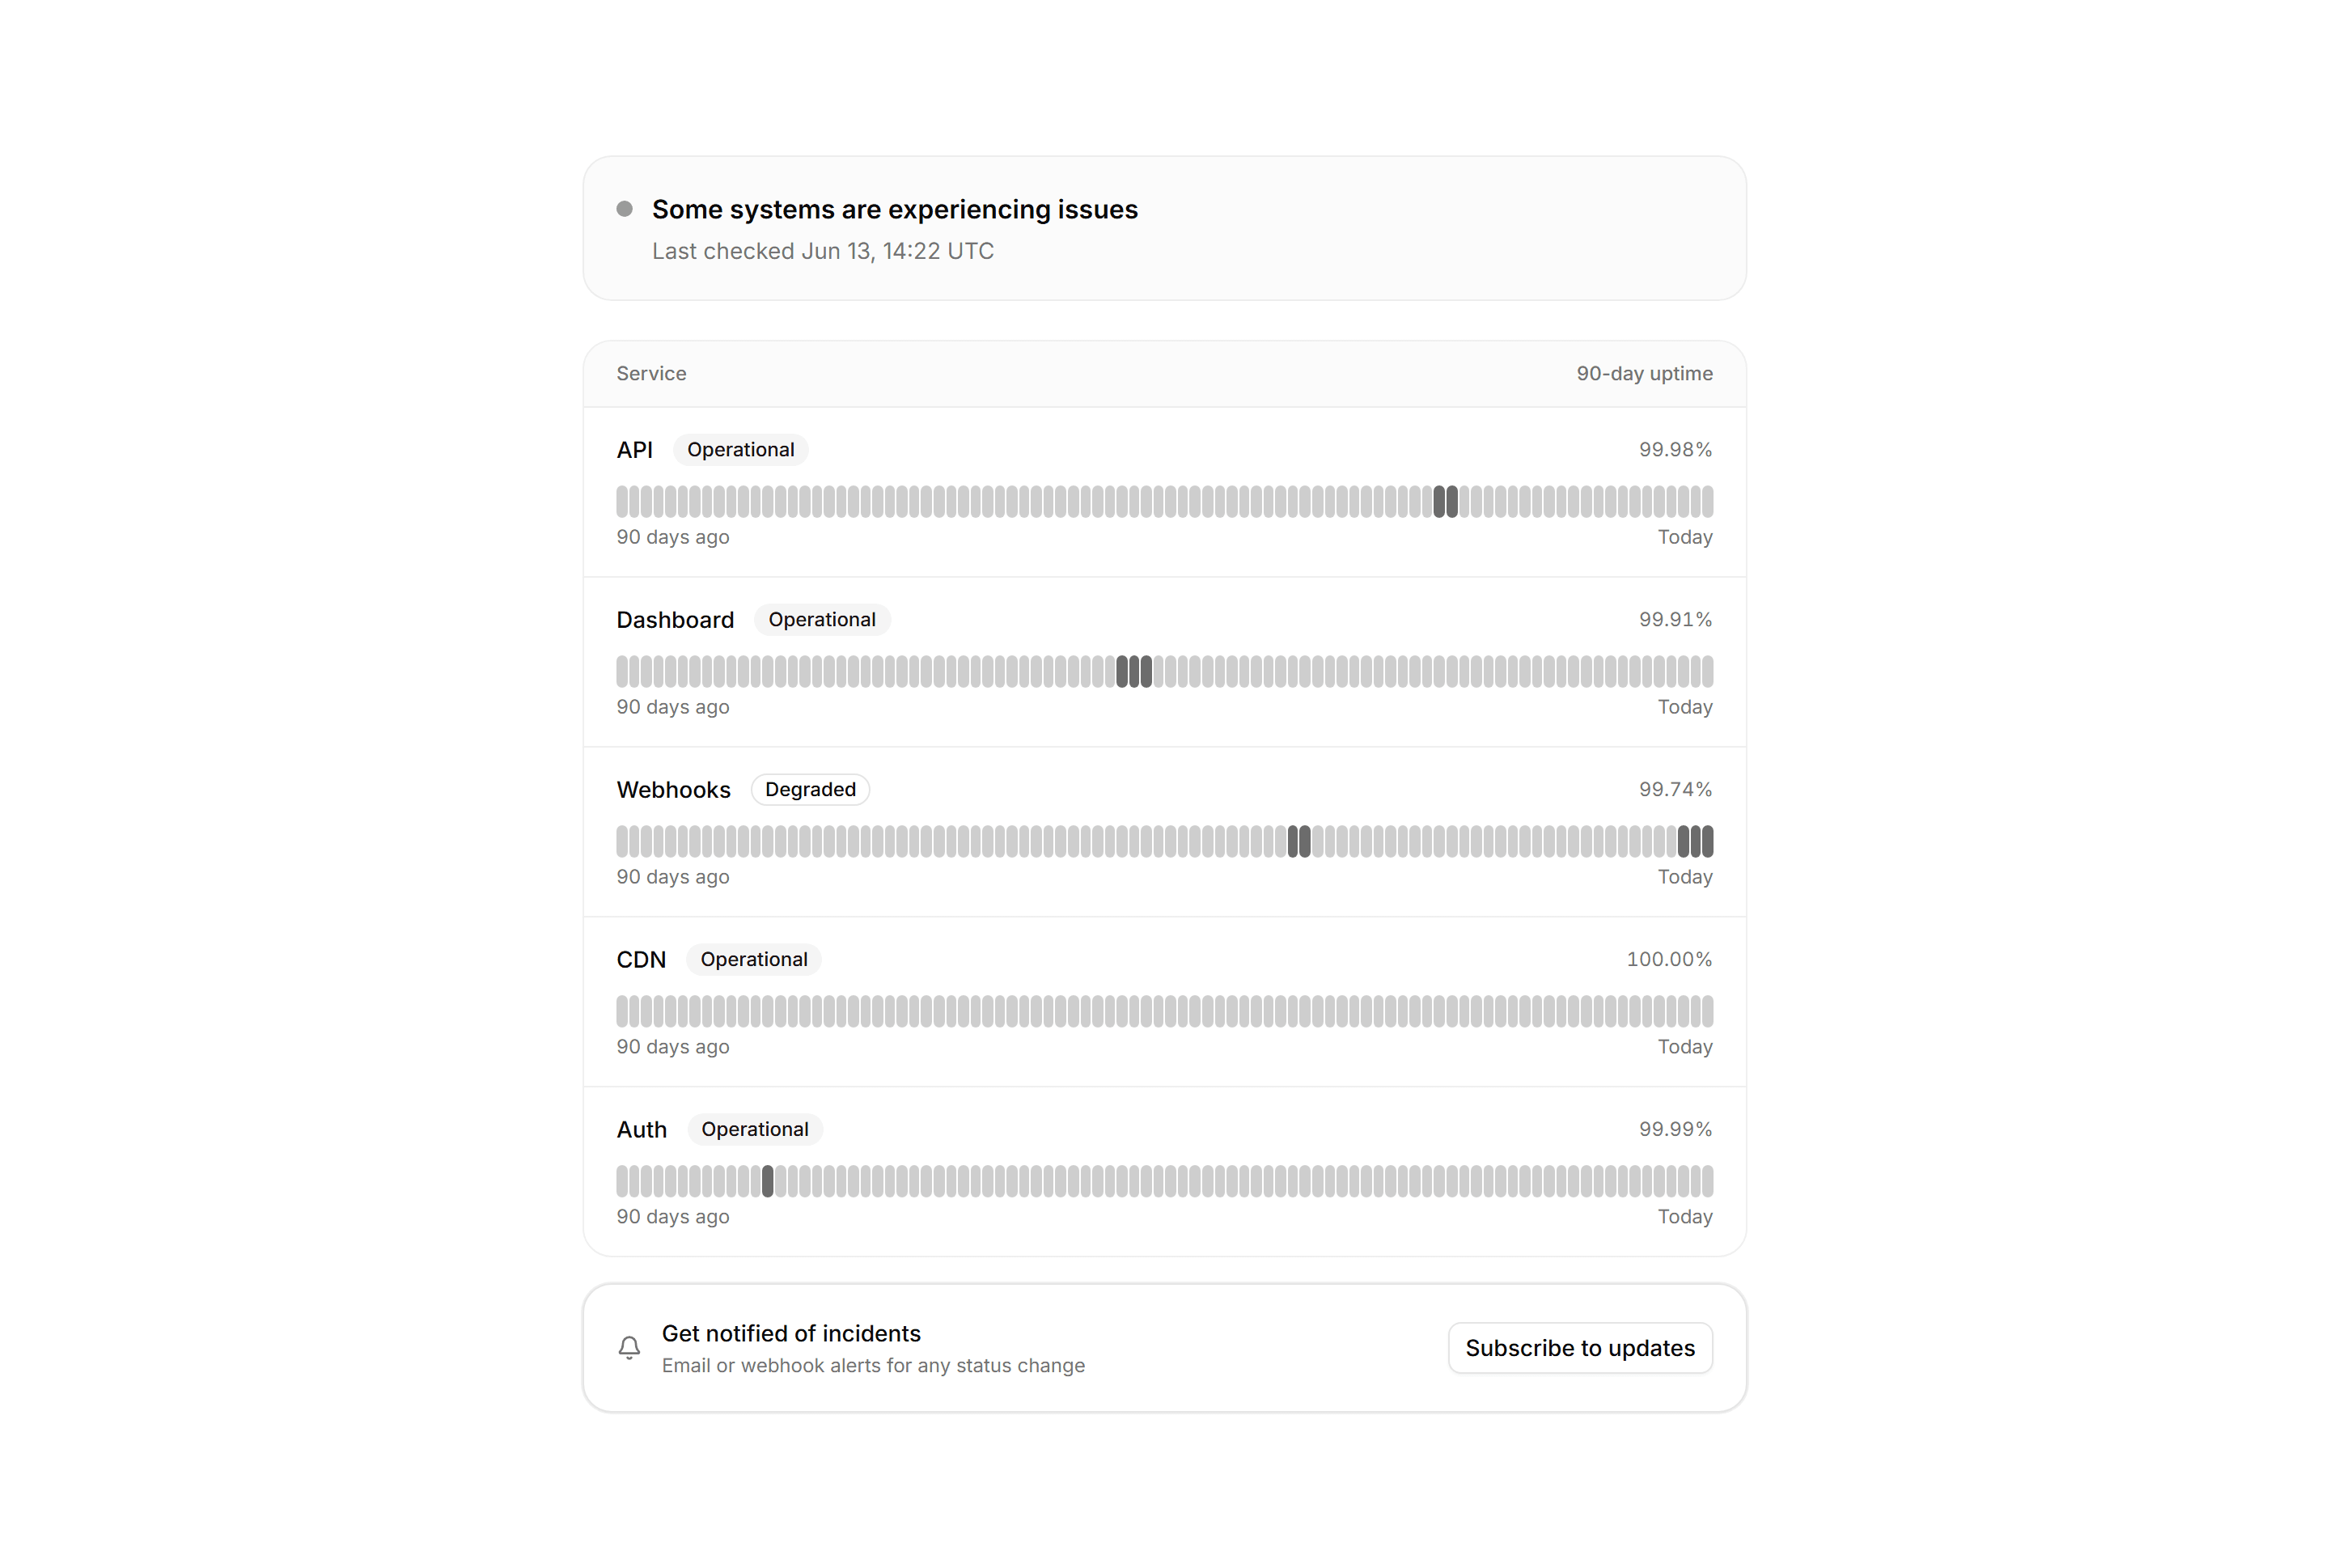
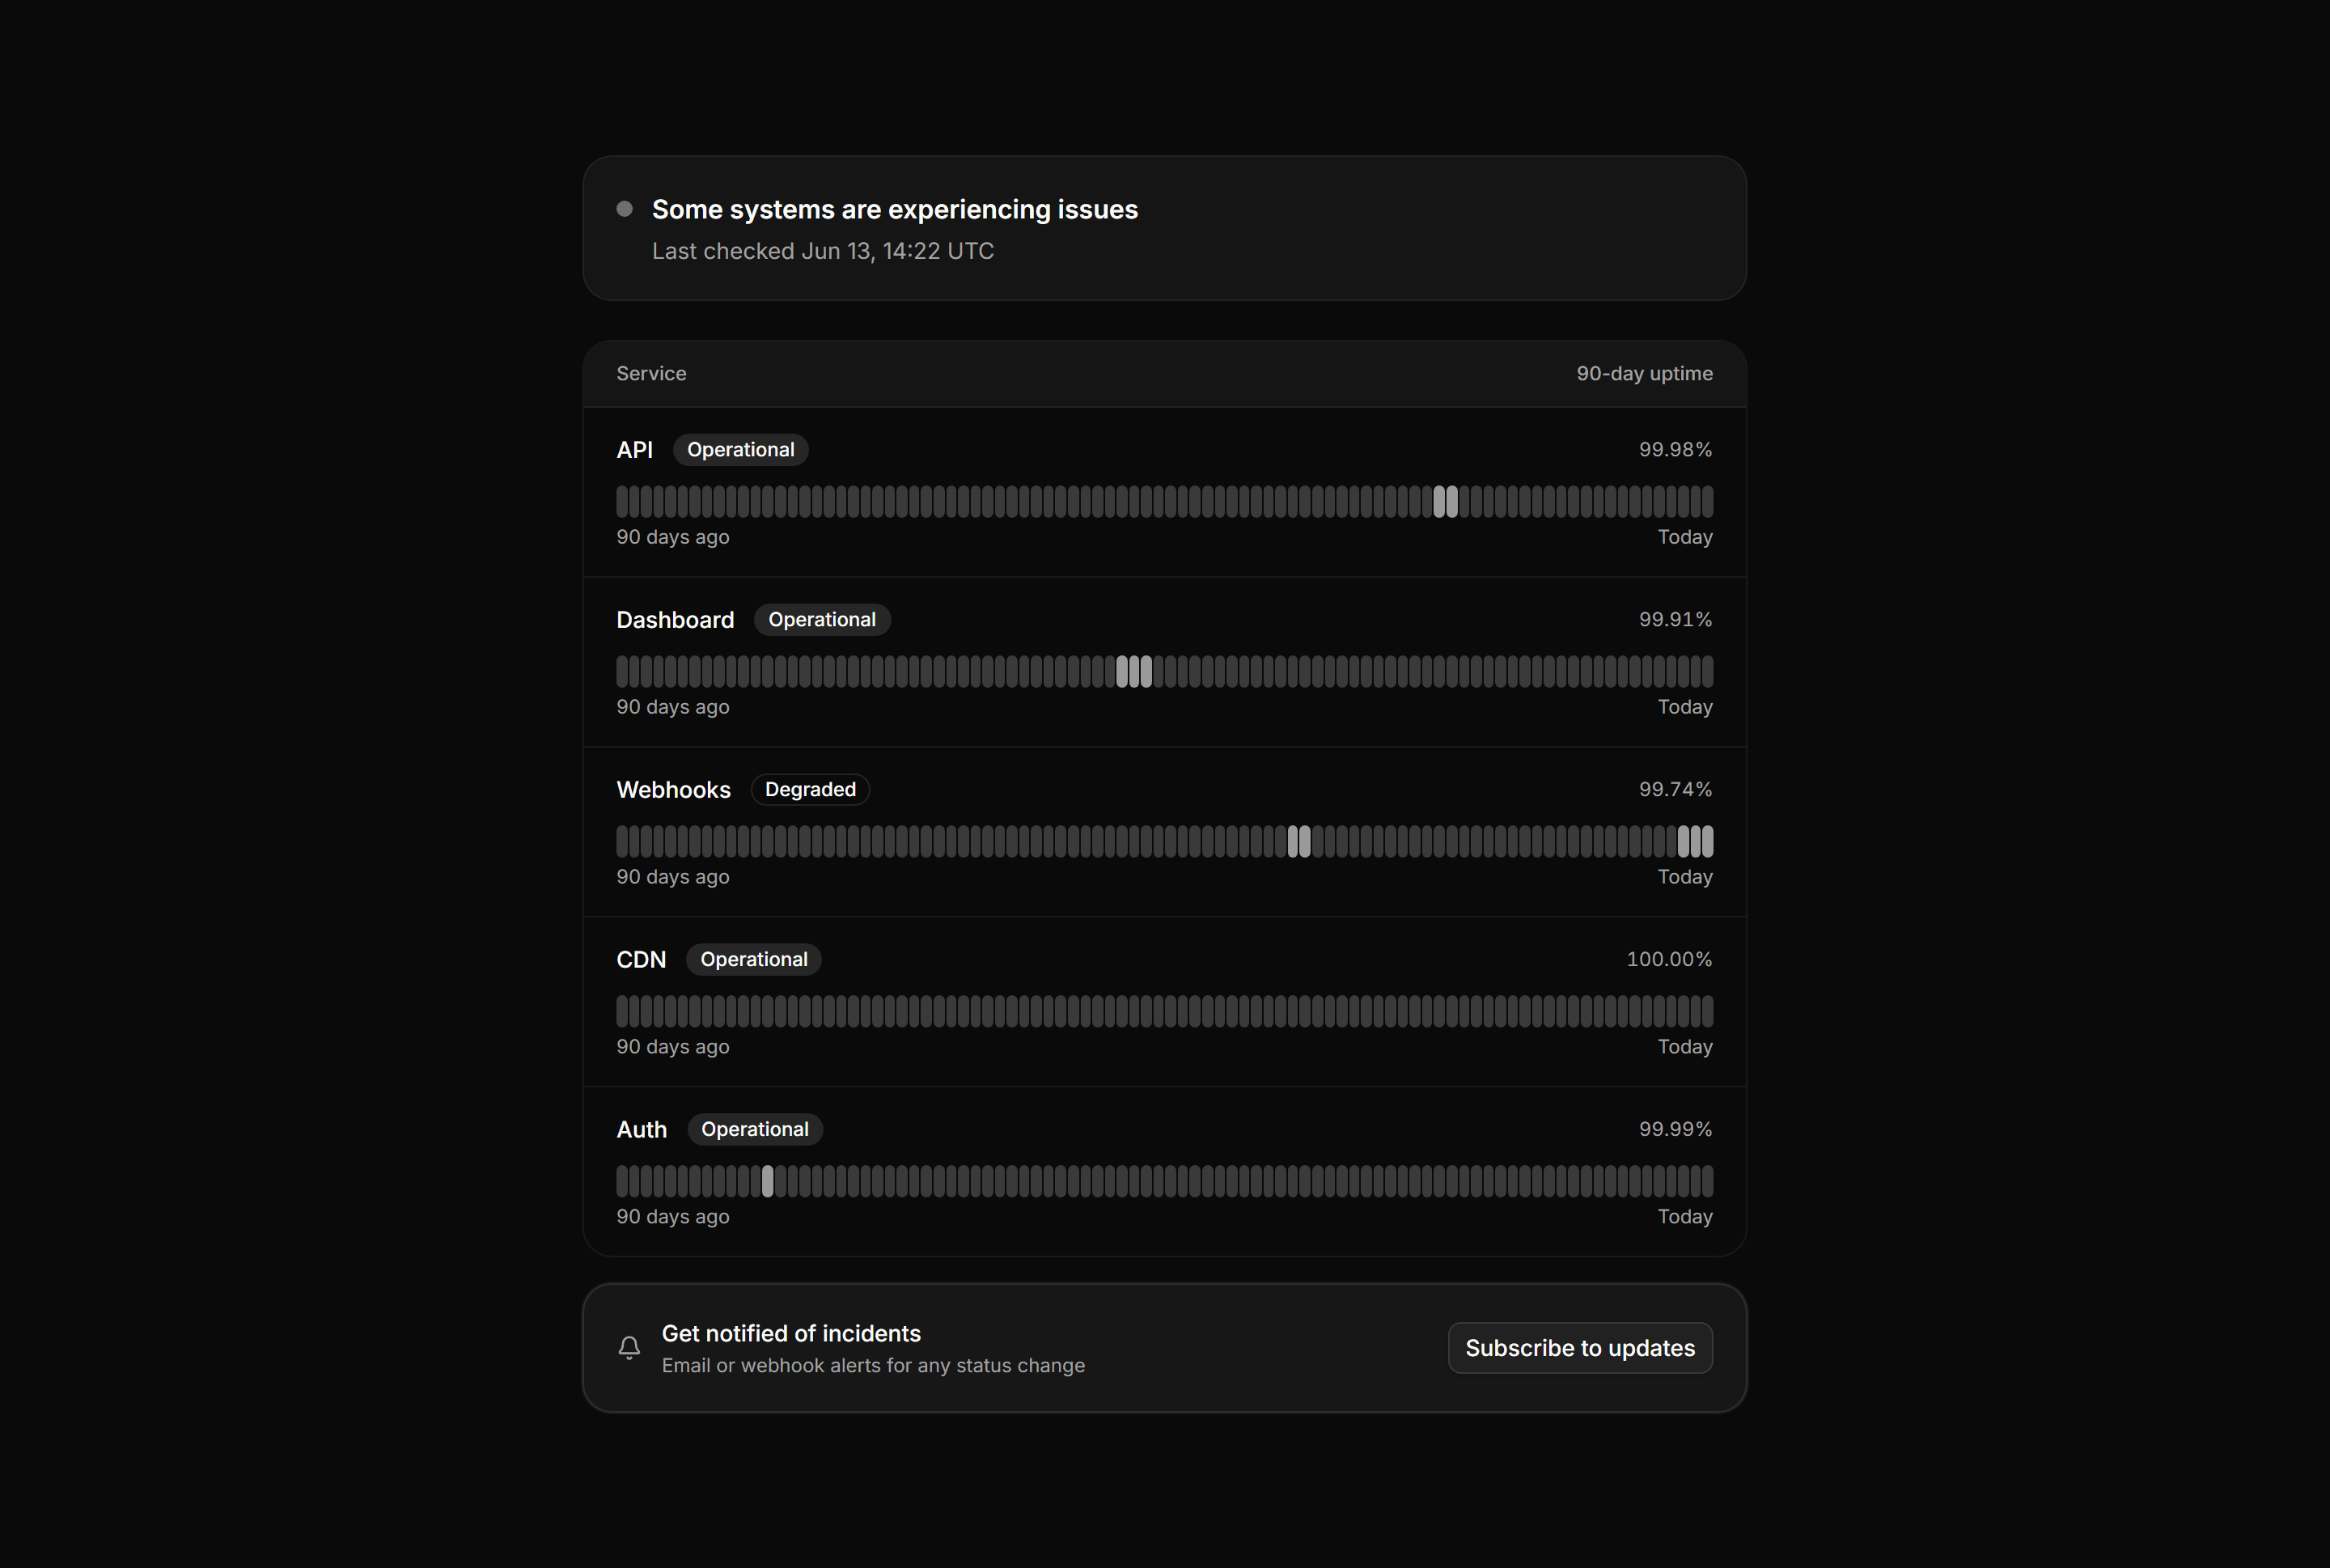
Application Status and Health: Status Page
Public status page with an overall operational banner, per-service uptime badges, 90-day tick strips, and a subscribe affordance.


Application Status and Health: Incident Banner
Slim dismissible incident alert bar with the incident start time, a status page link, and a subscribe affordance.
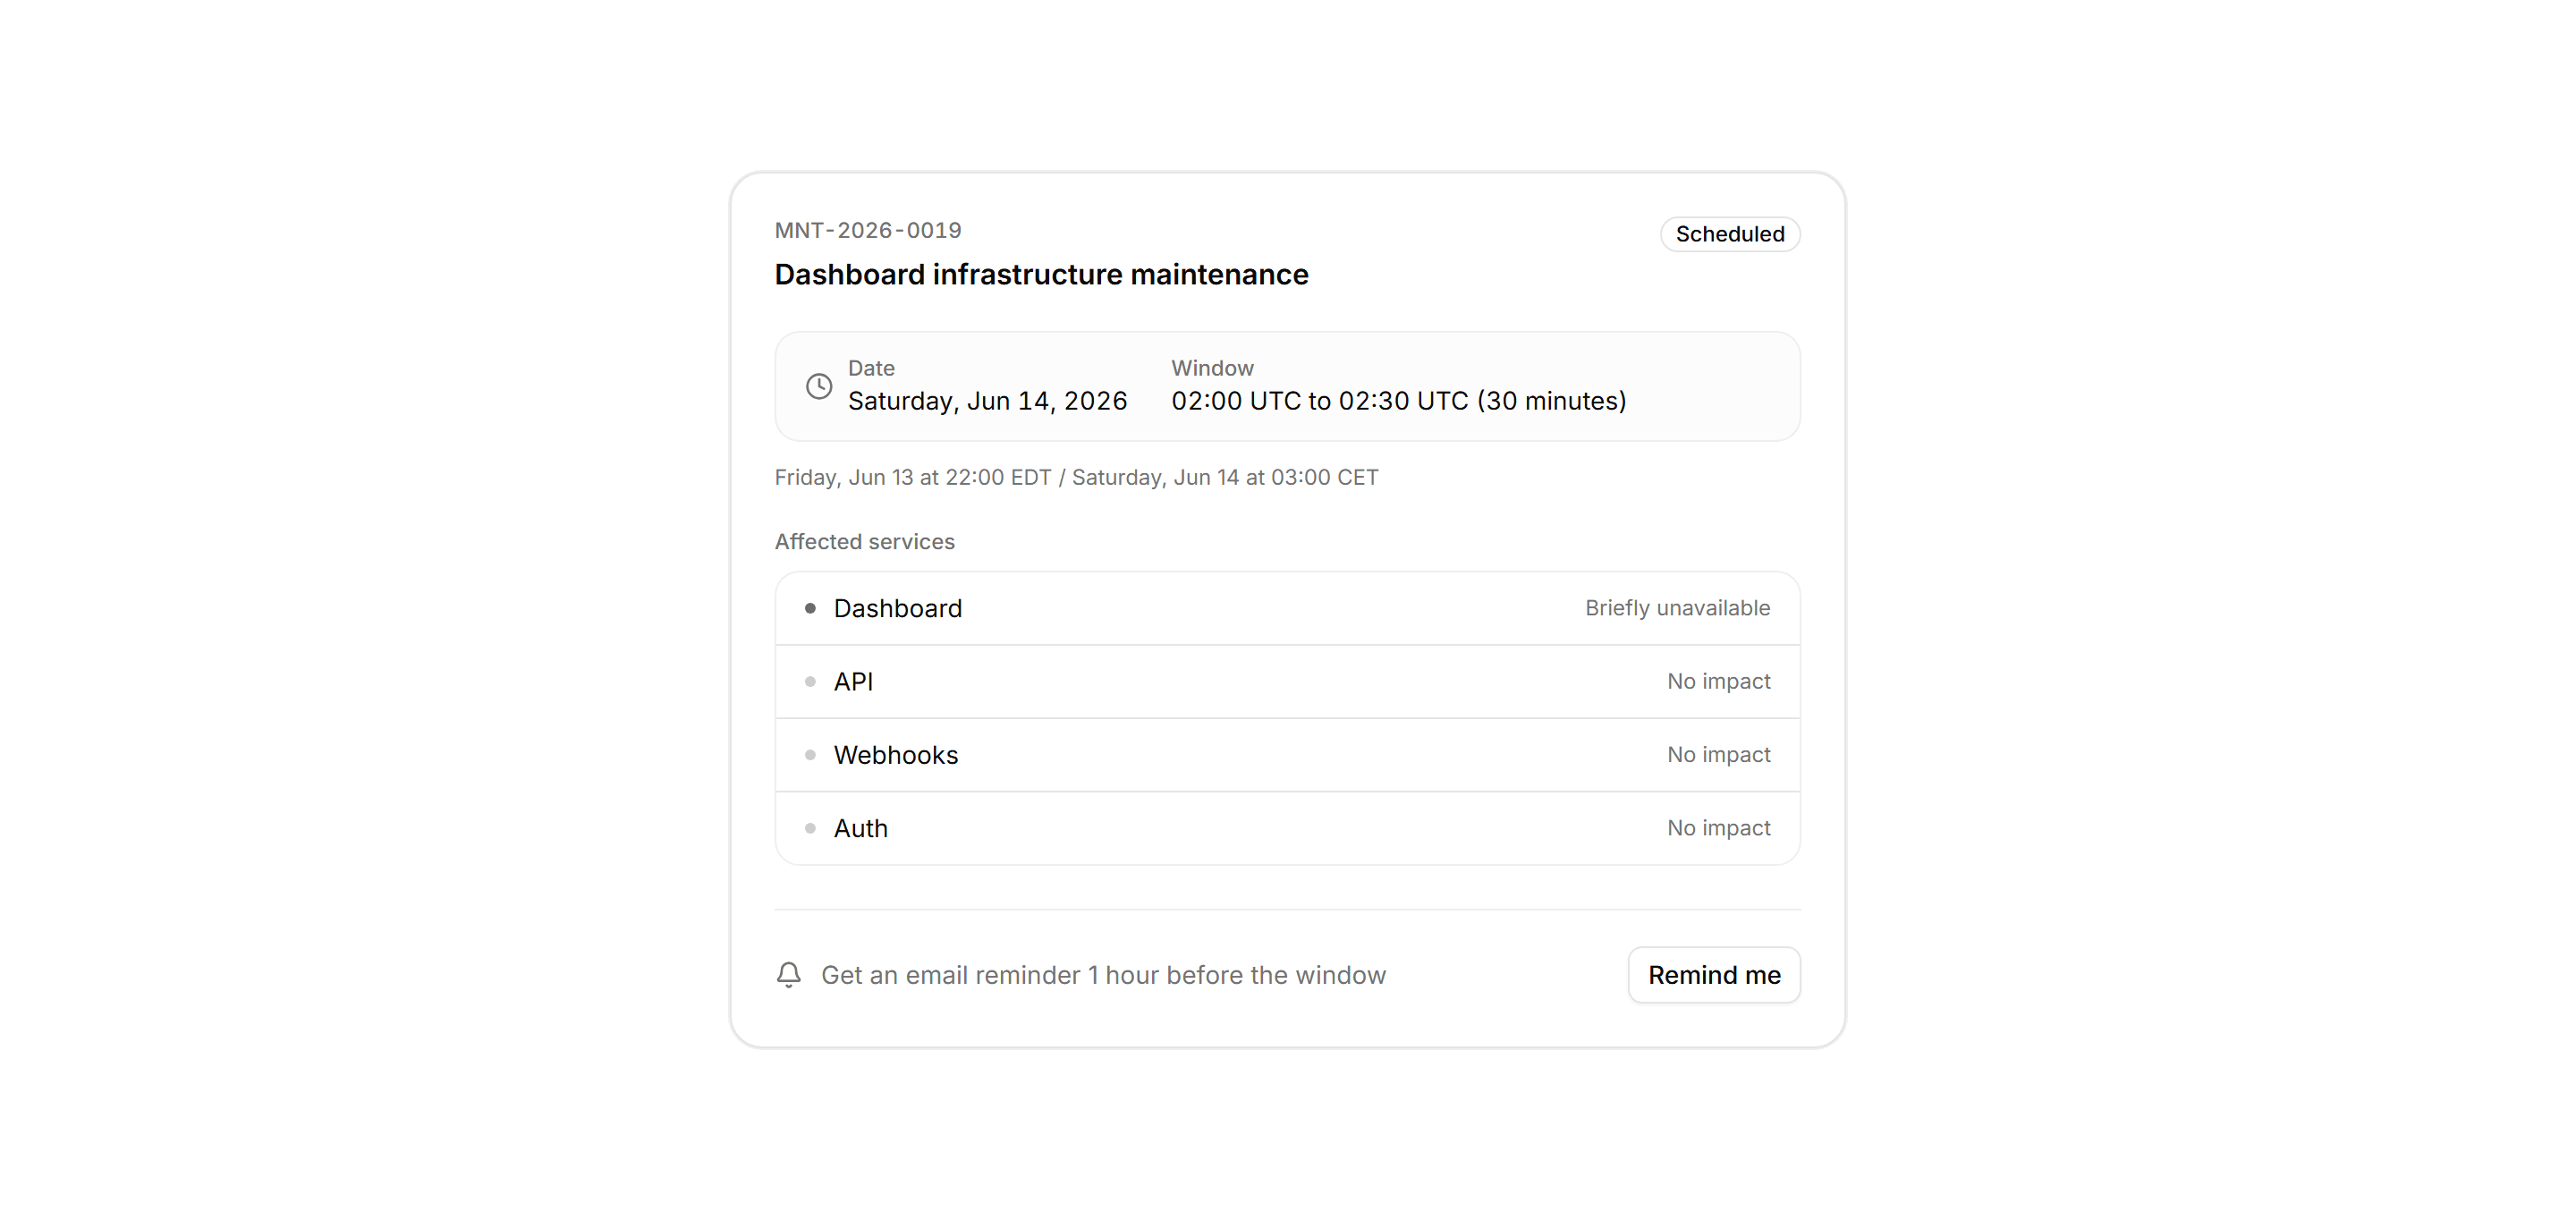
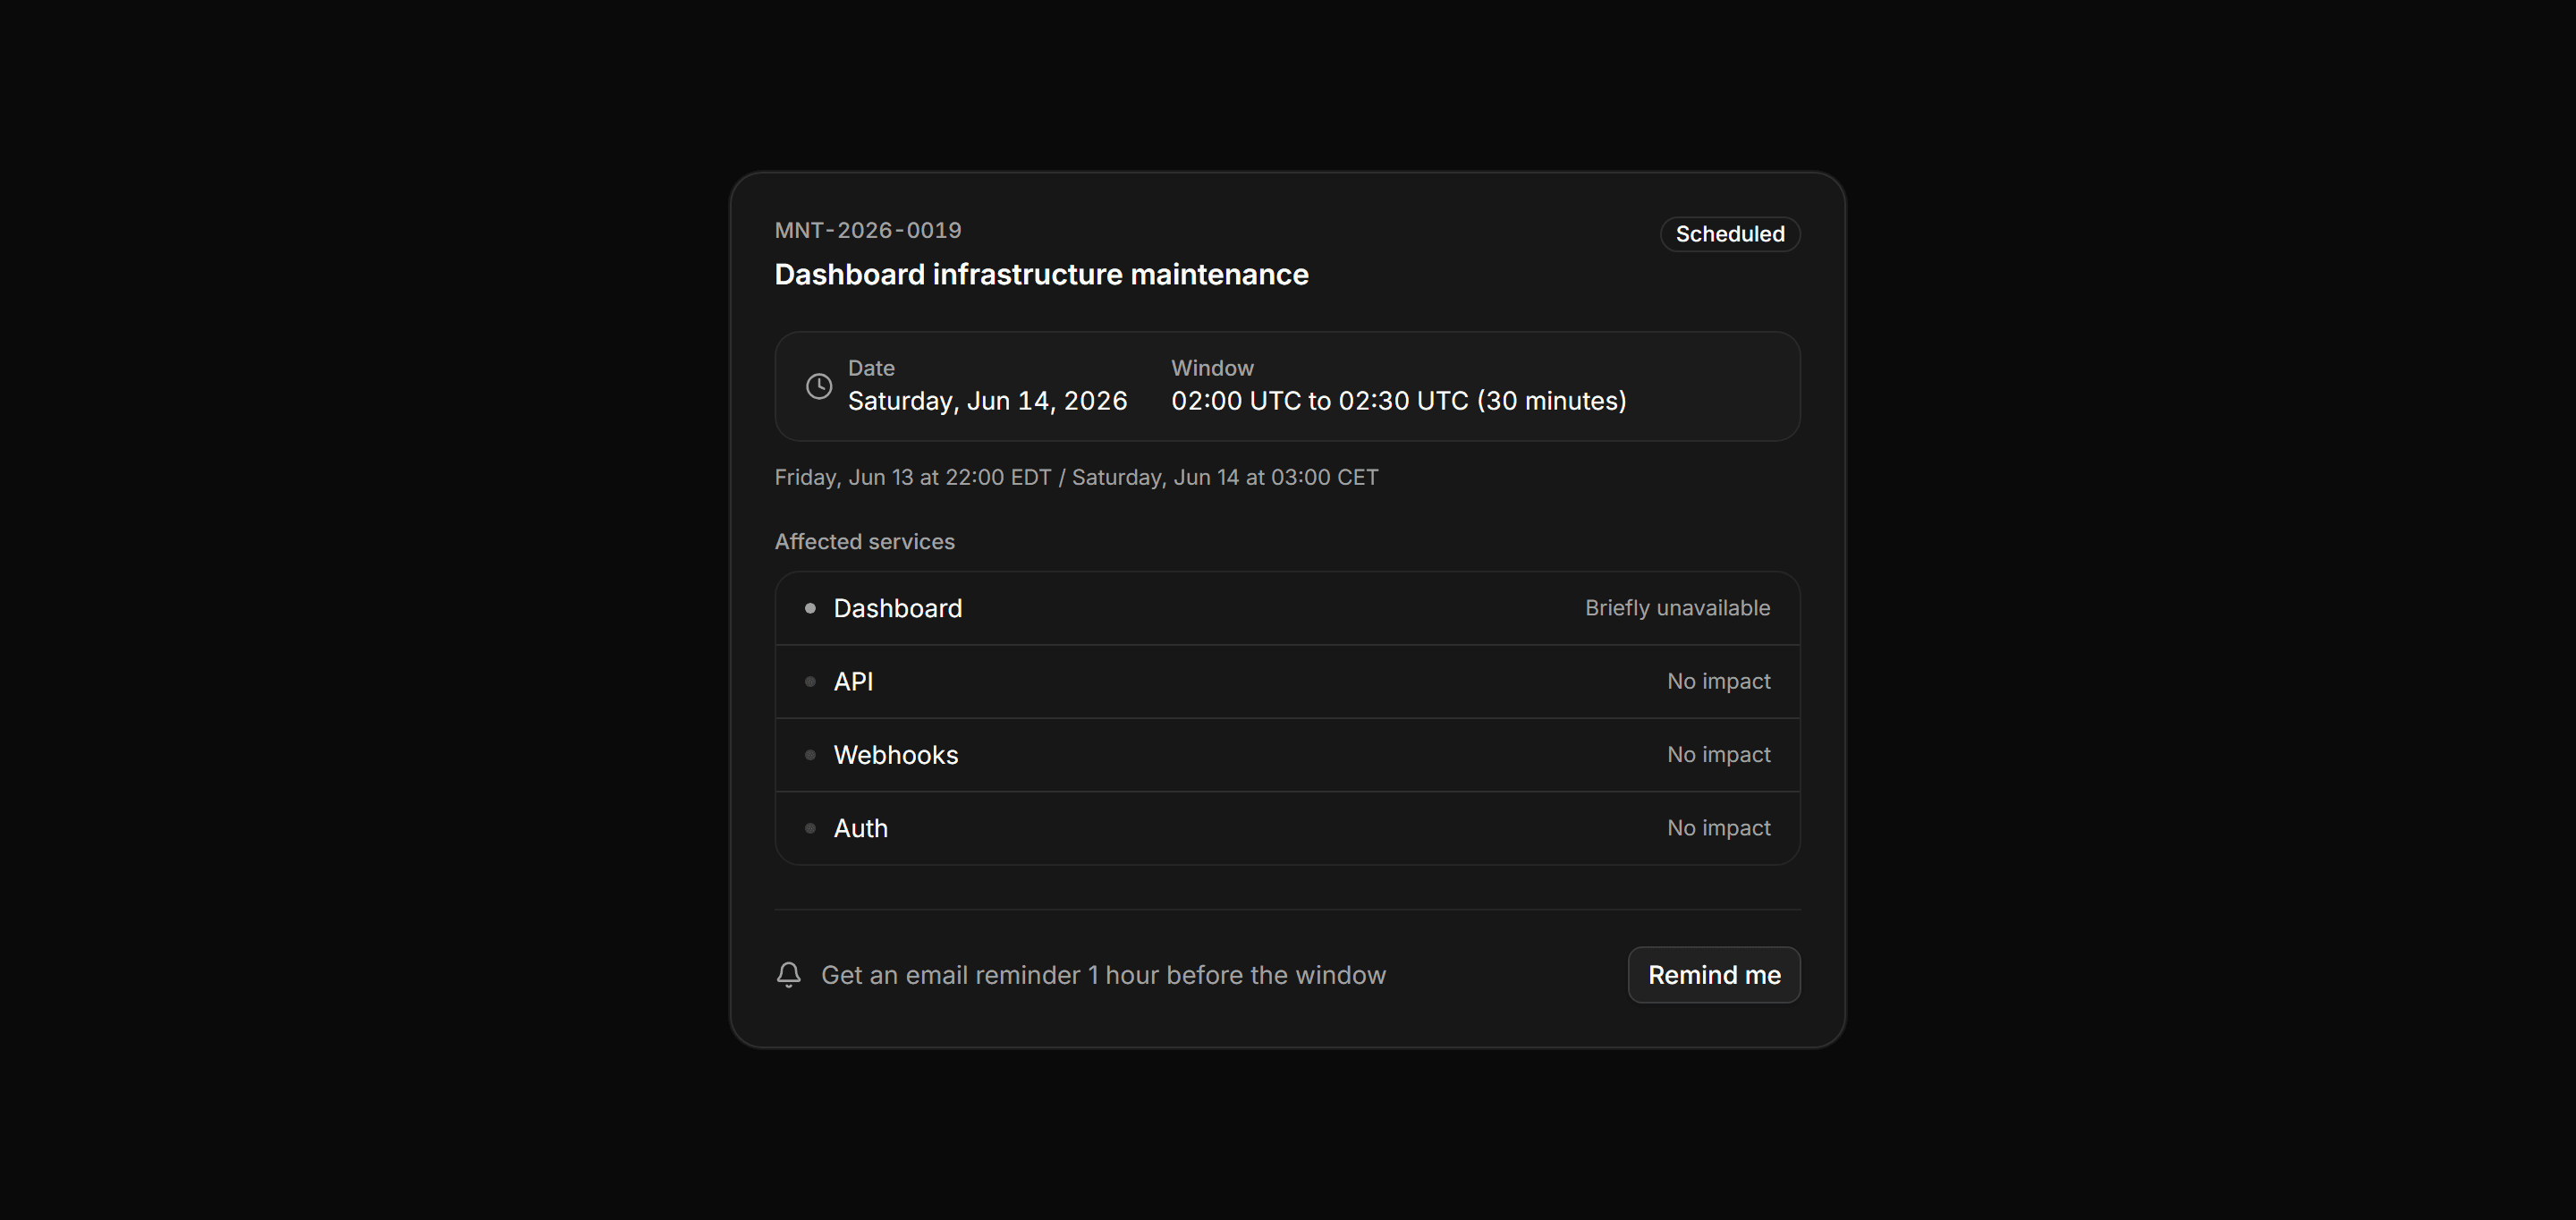
Application Status and Health: Maintenance Window Card
Scheduled maintenance notice showing the UTC window, timezone conversions, affected services, and a remind-me email affordance.
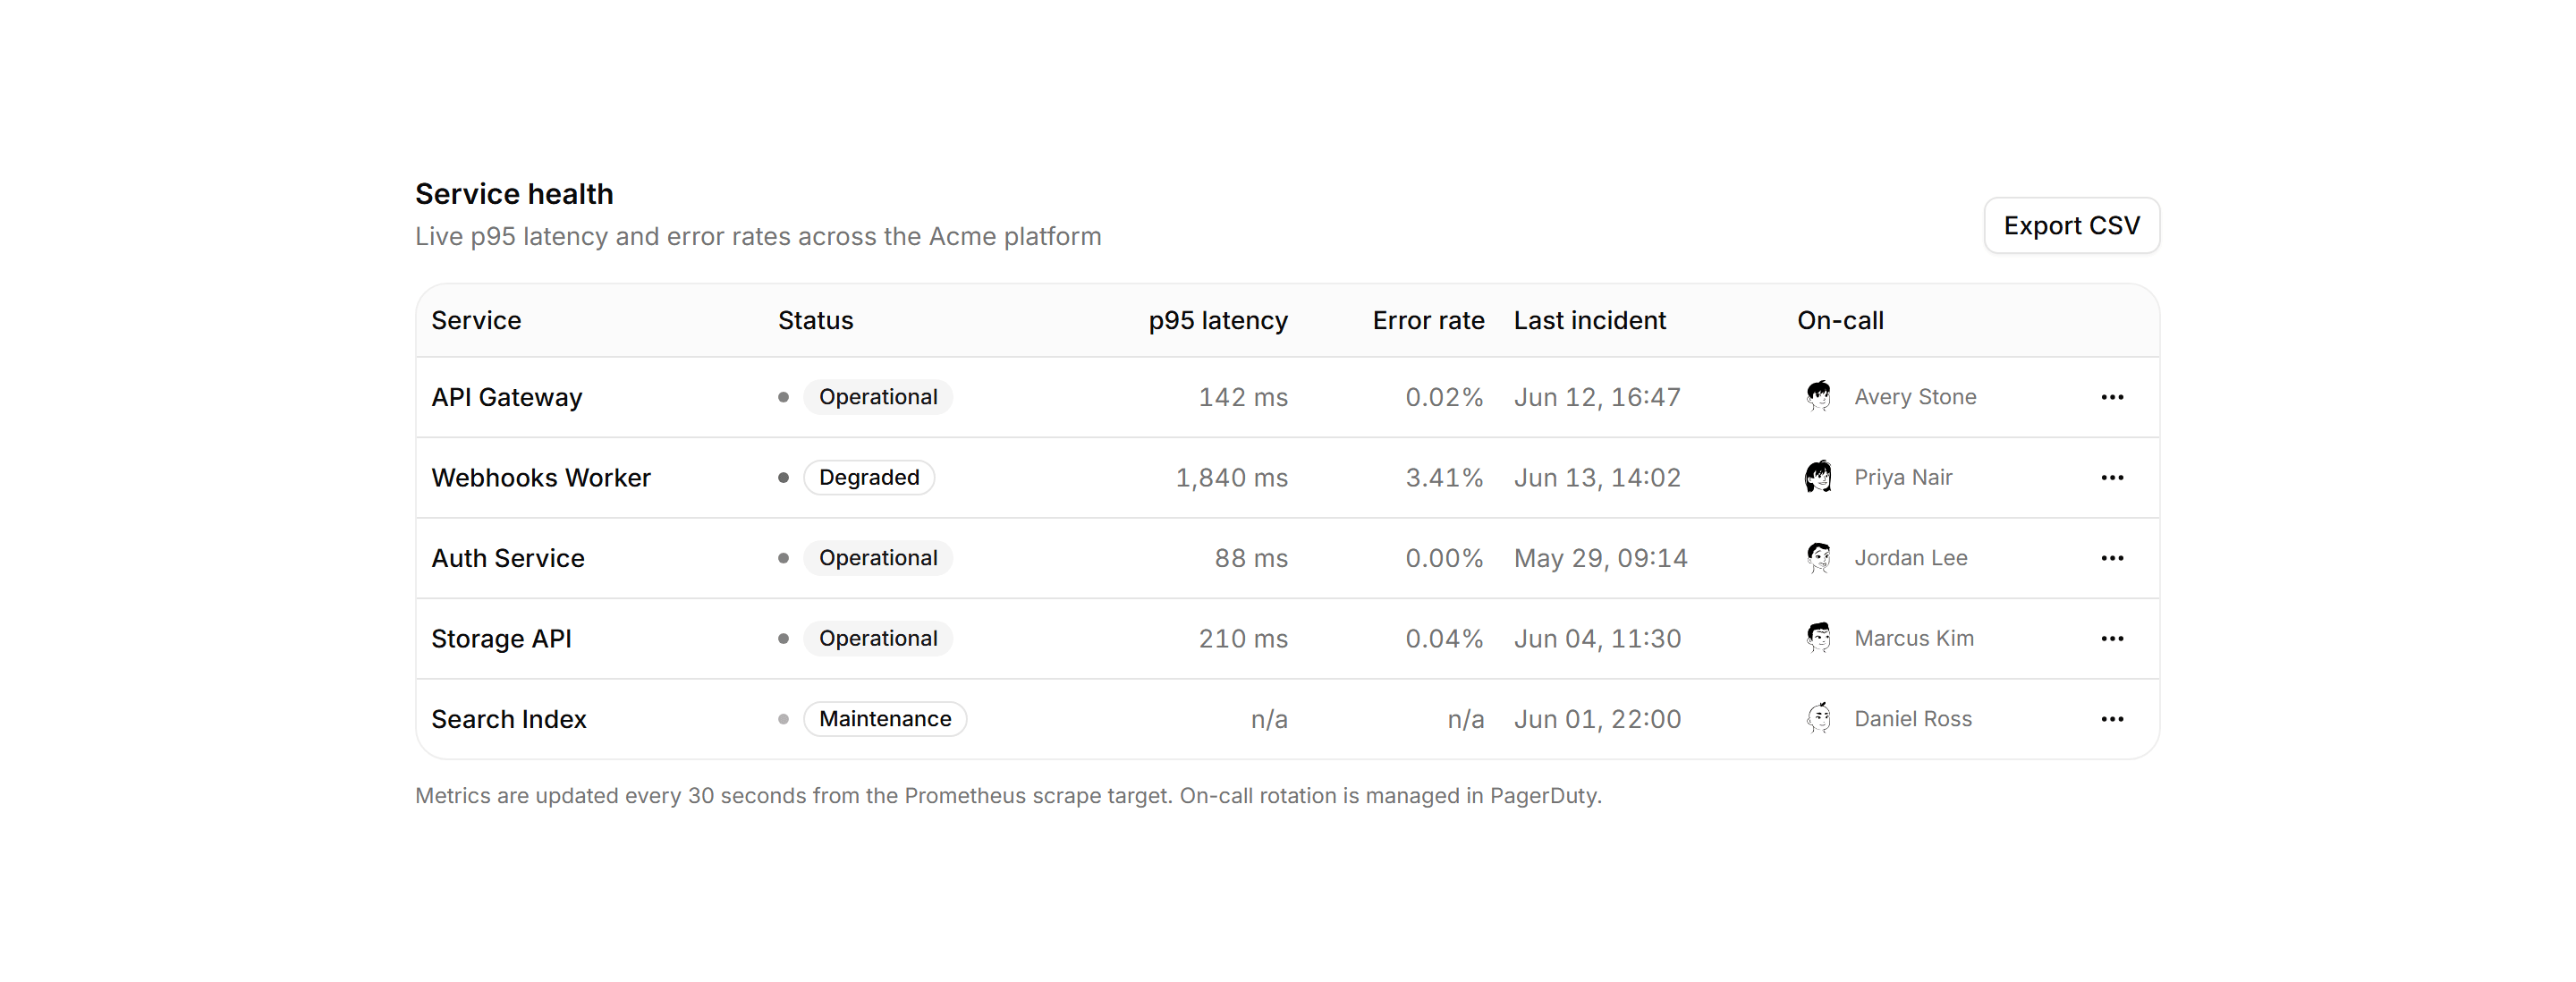
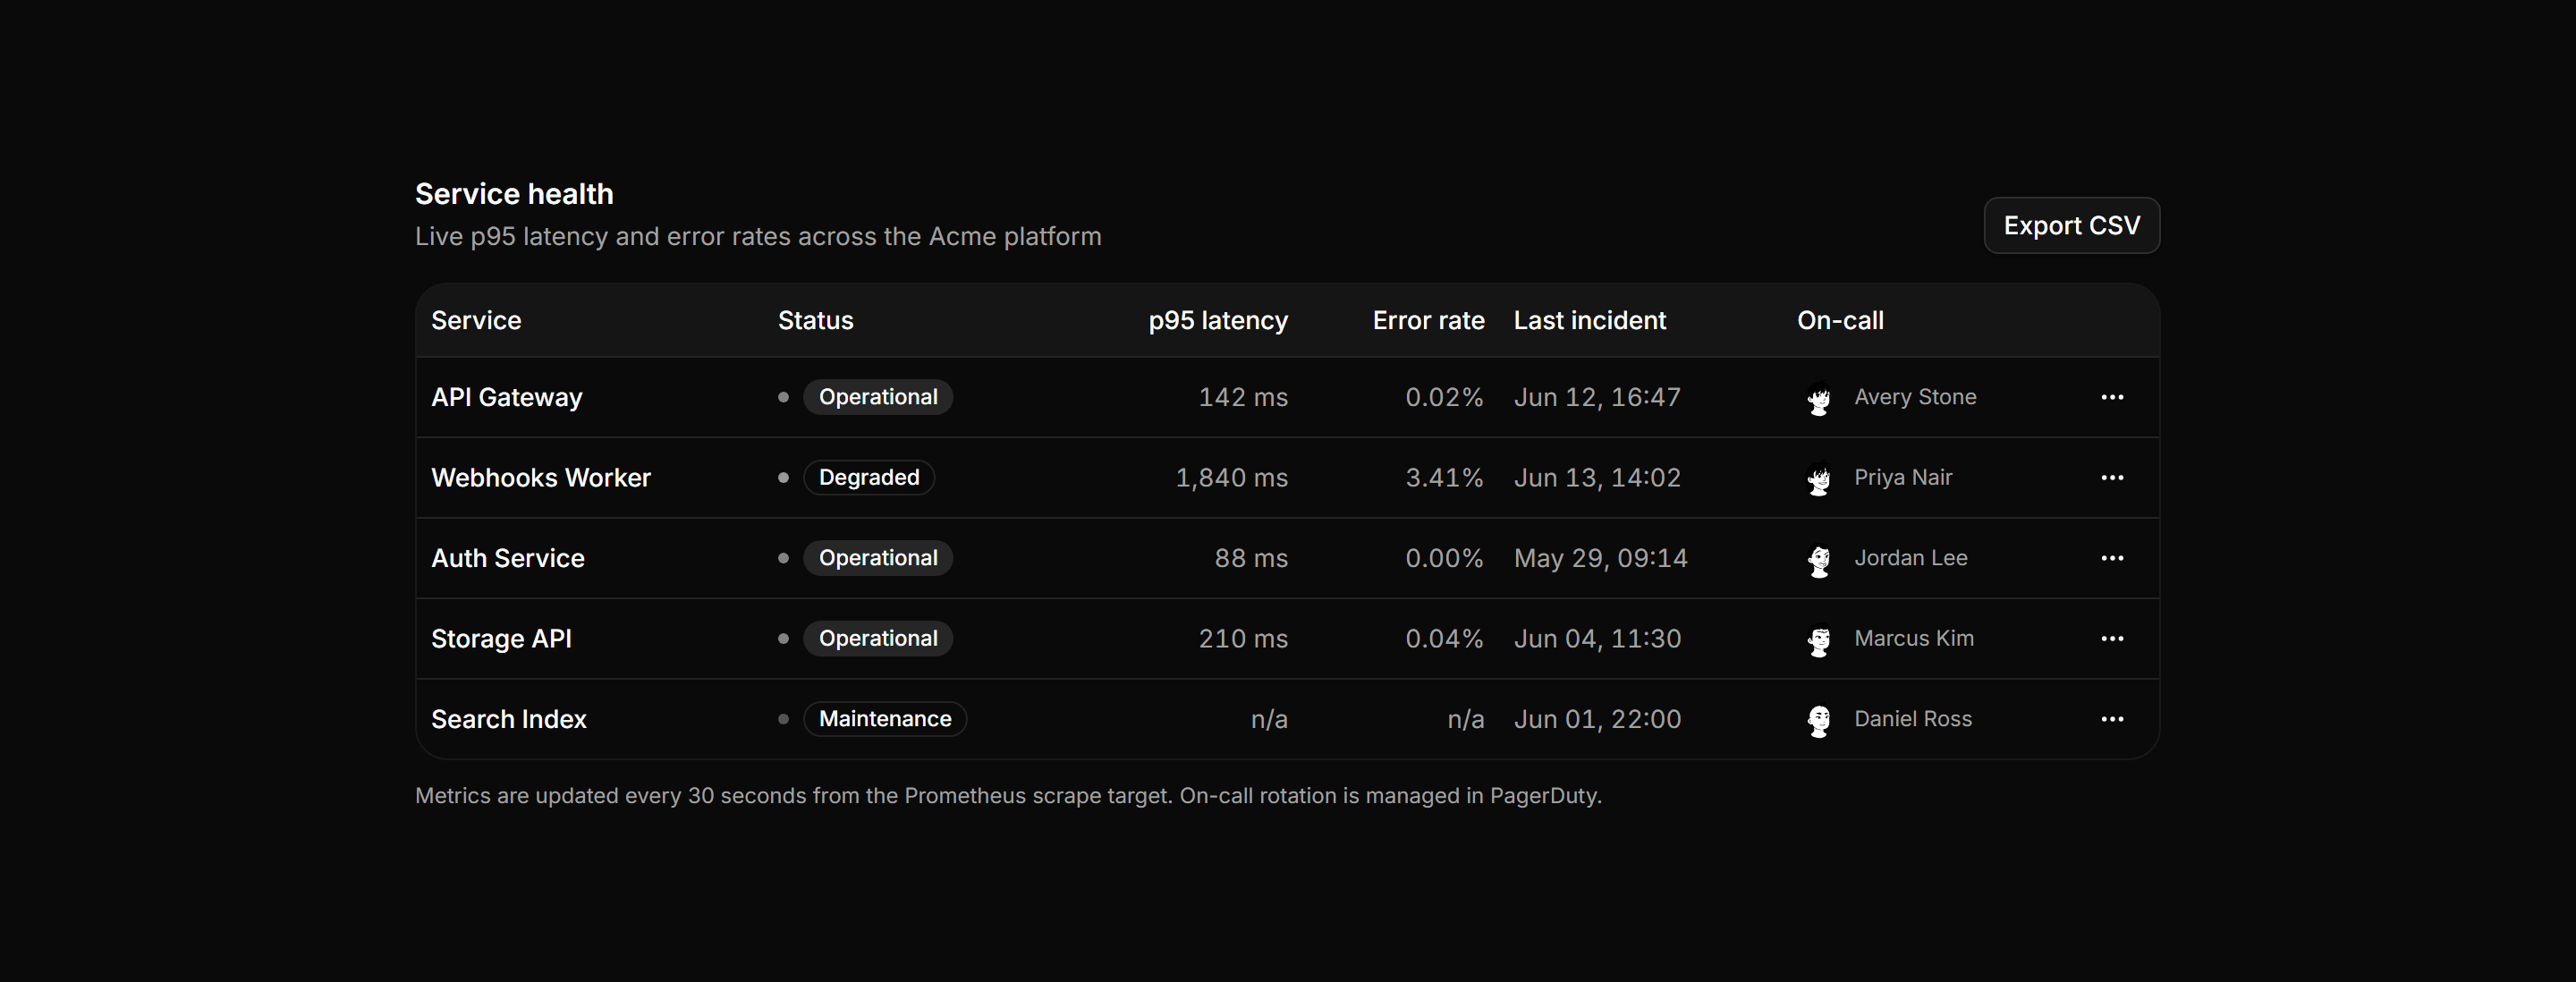
Application Status and Health: Service Health Table
Internal ops table listing services with status badges, p95 latency, error rate, last incident time, and the on-call engineer avatar.
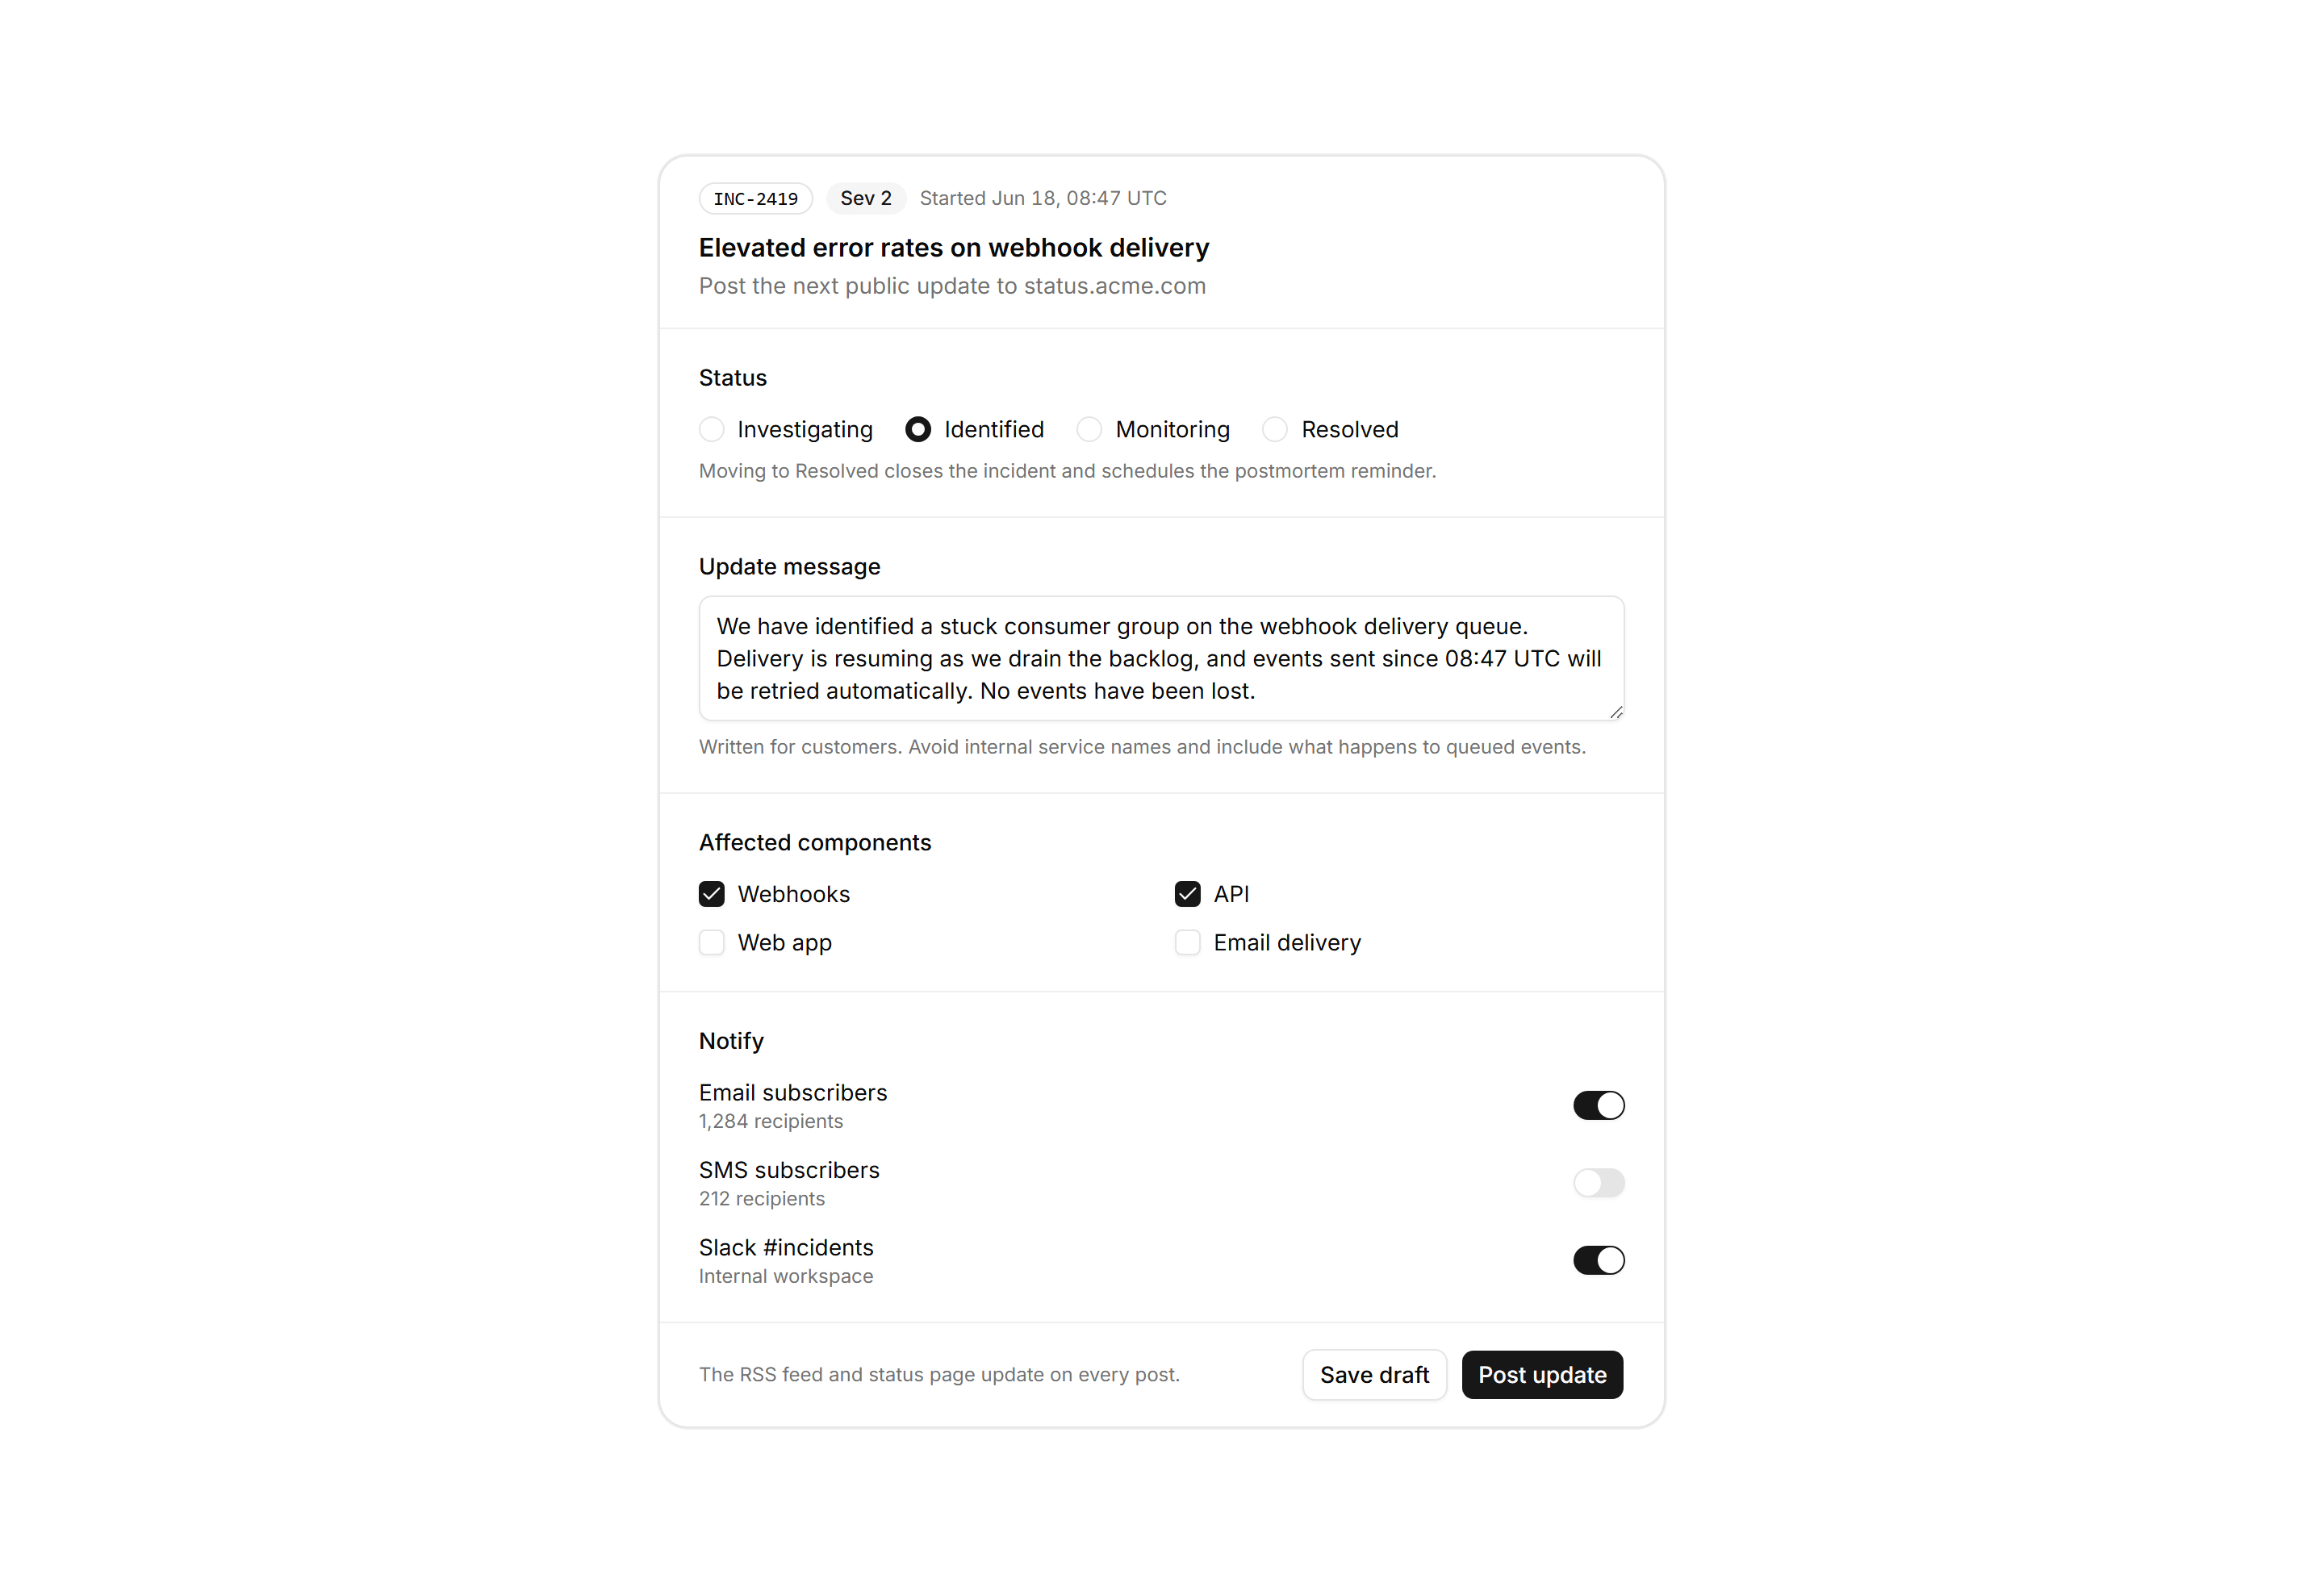
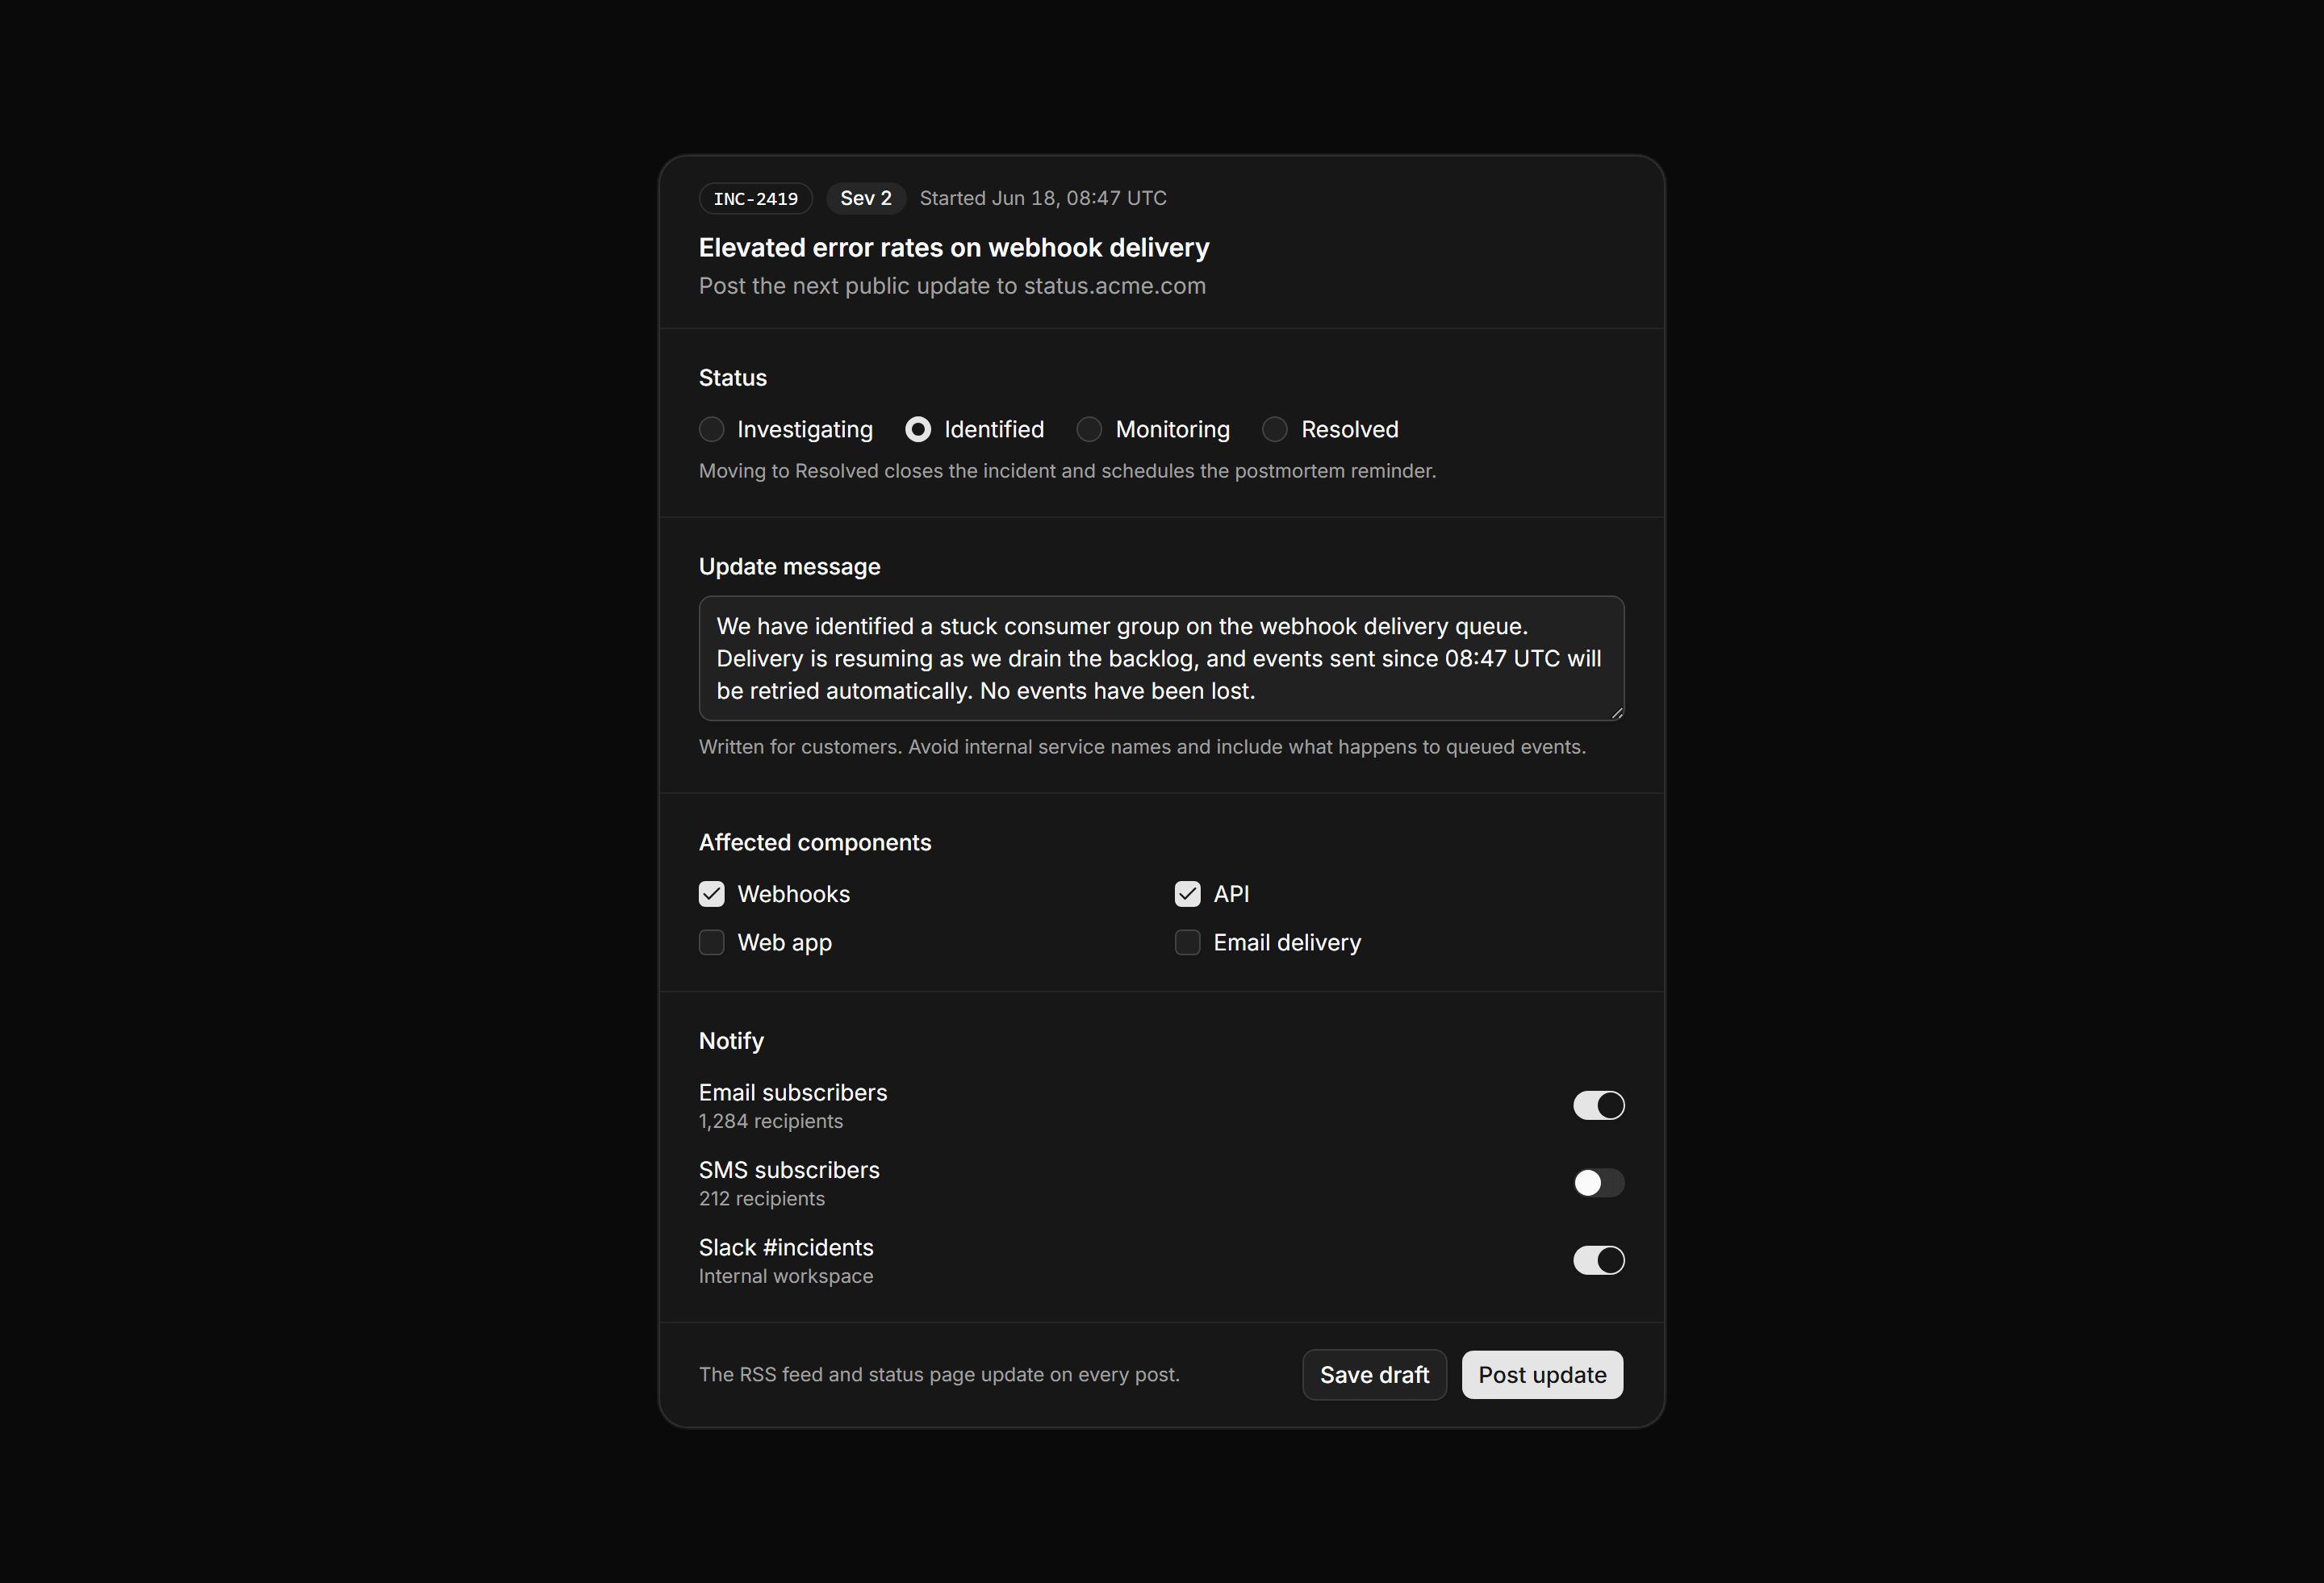
Application Status and Health: Incident Update Composer
An incident update form with a header, a status phase radio group, a message field, component checkboxes, notification switches, and post actions.
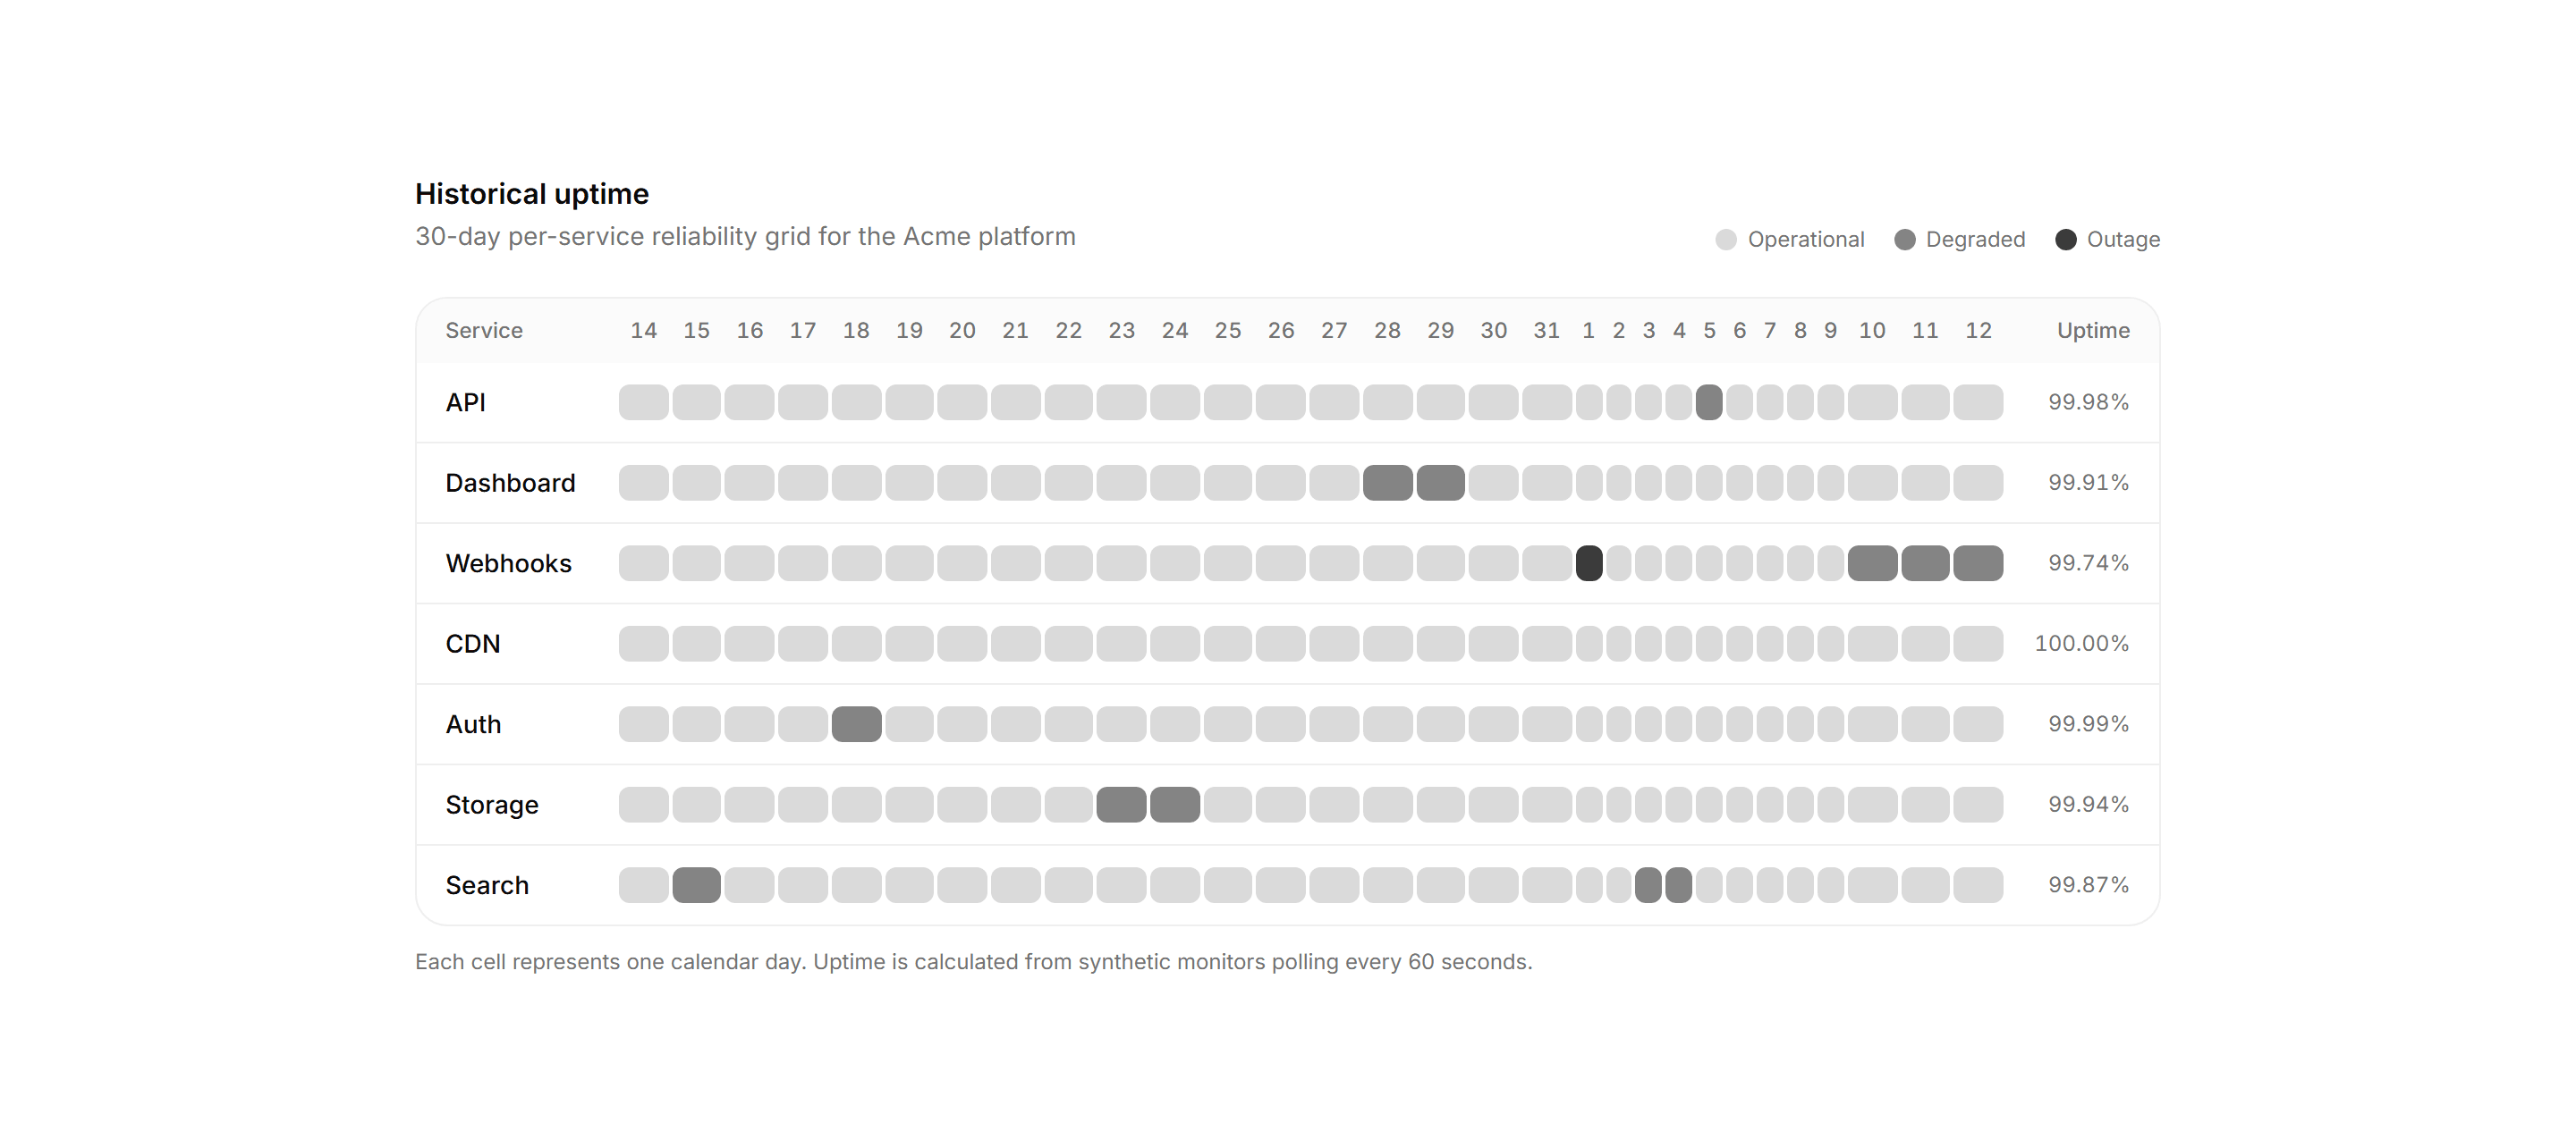
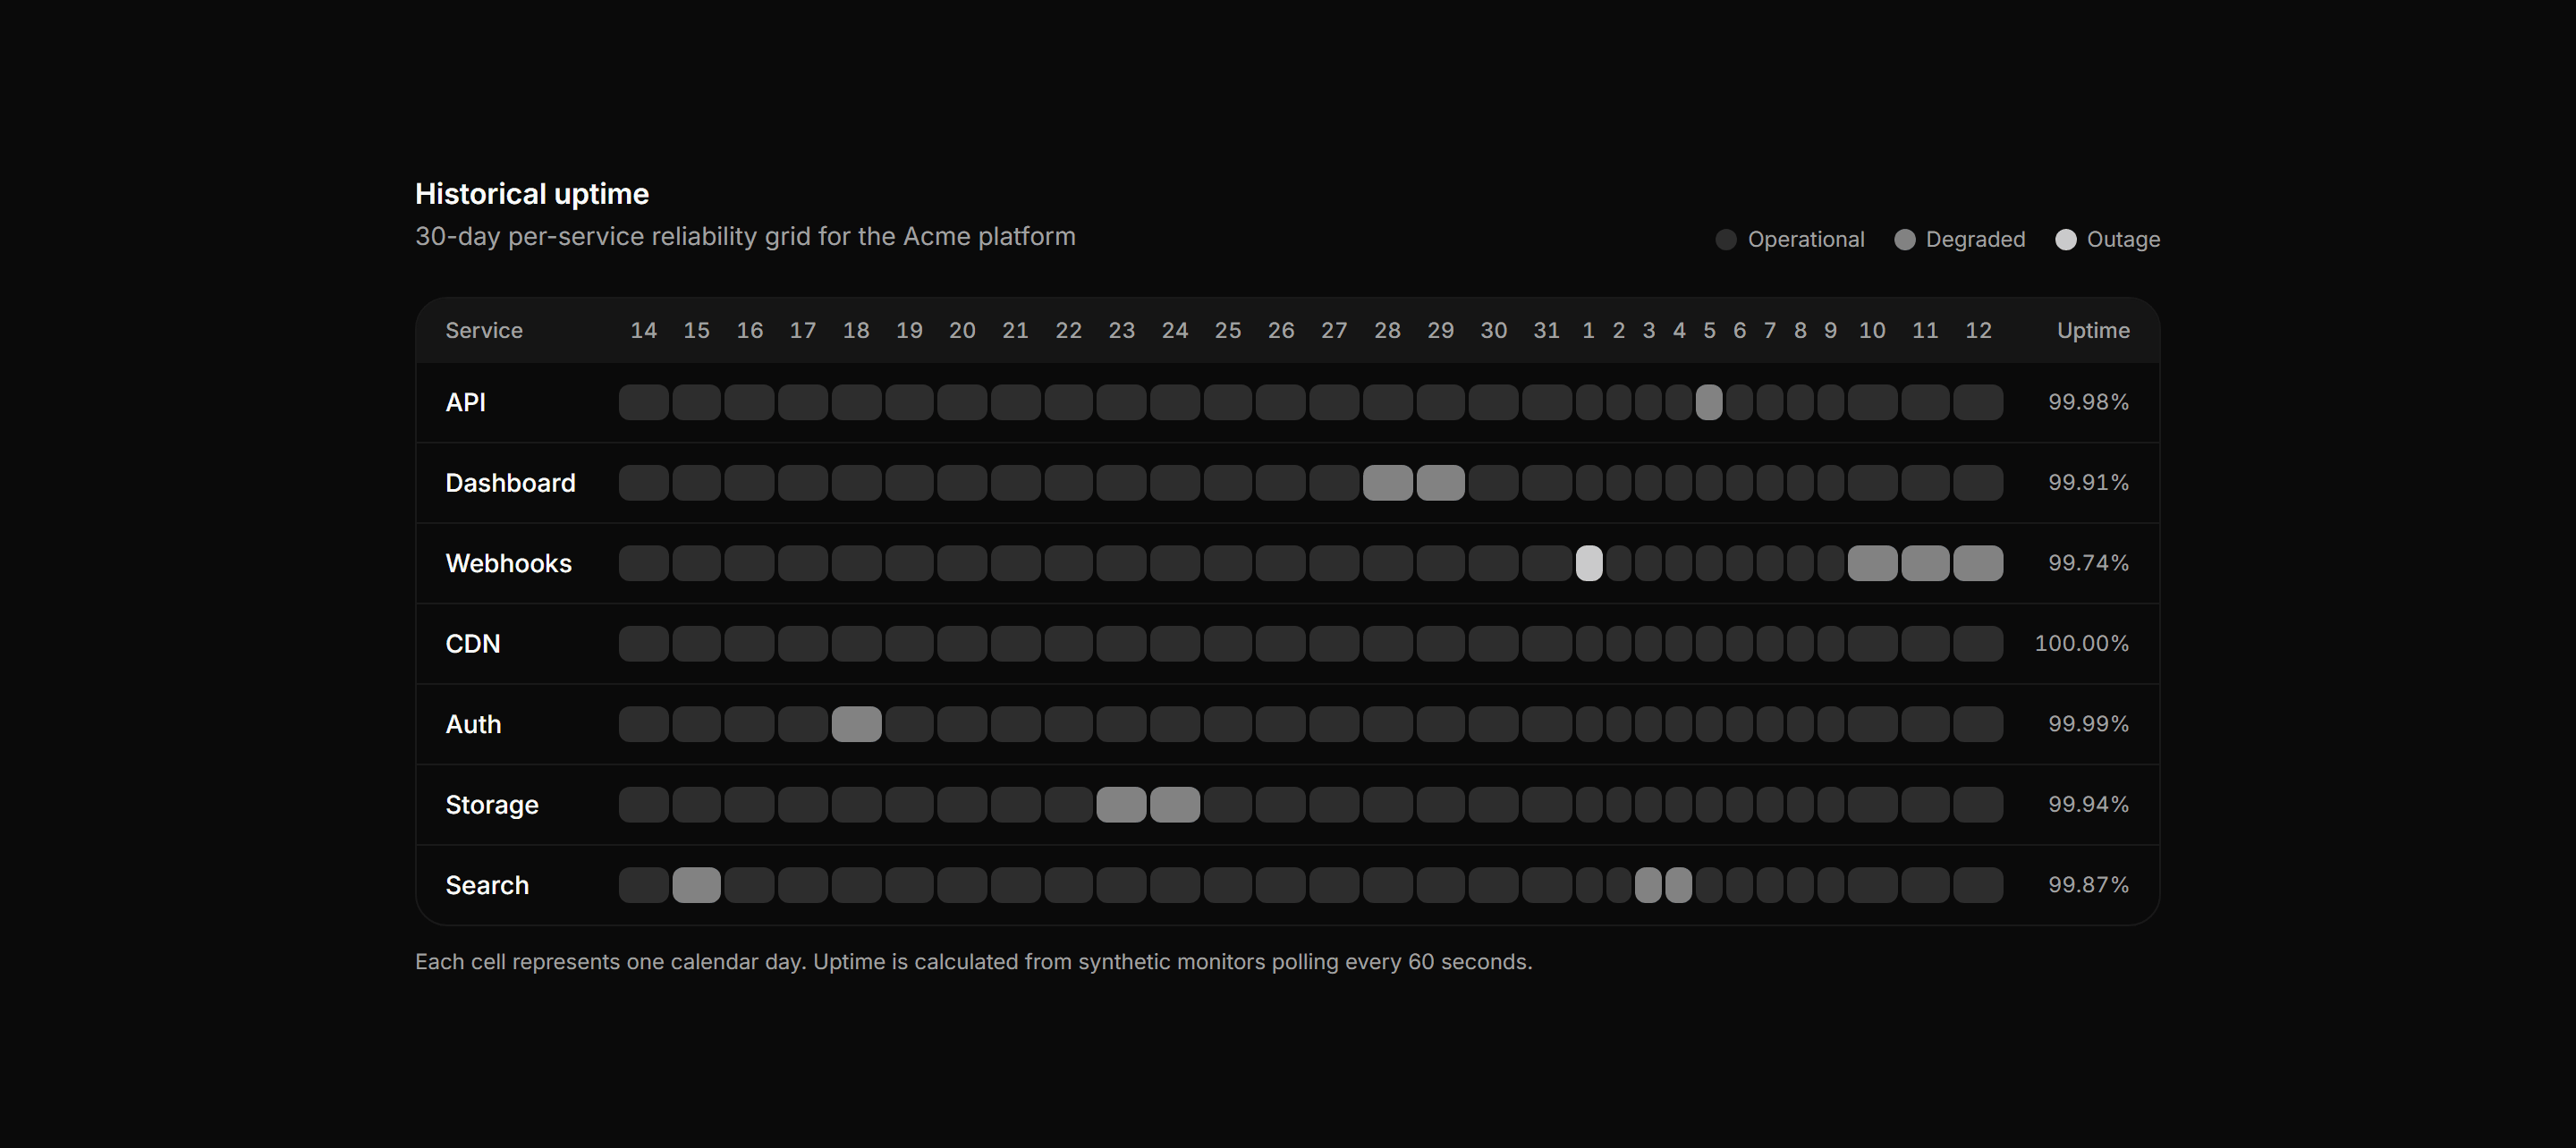
Application Status and Health: Uptime Grid
30-day per-service reliability grid with each cell shaded by status using foreground opacity tokens and a per-row uptime figure.
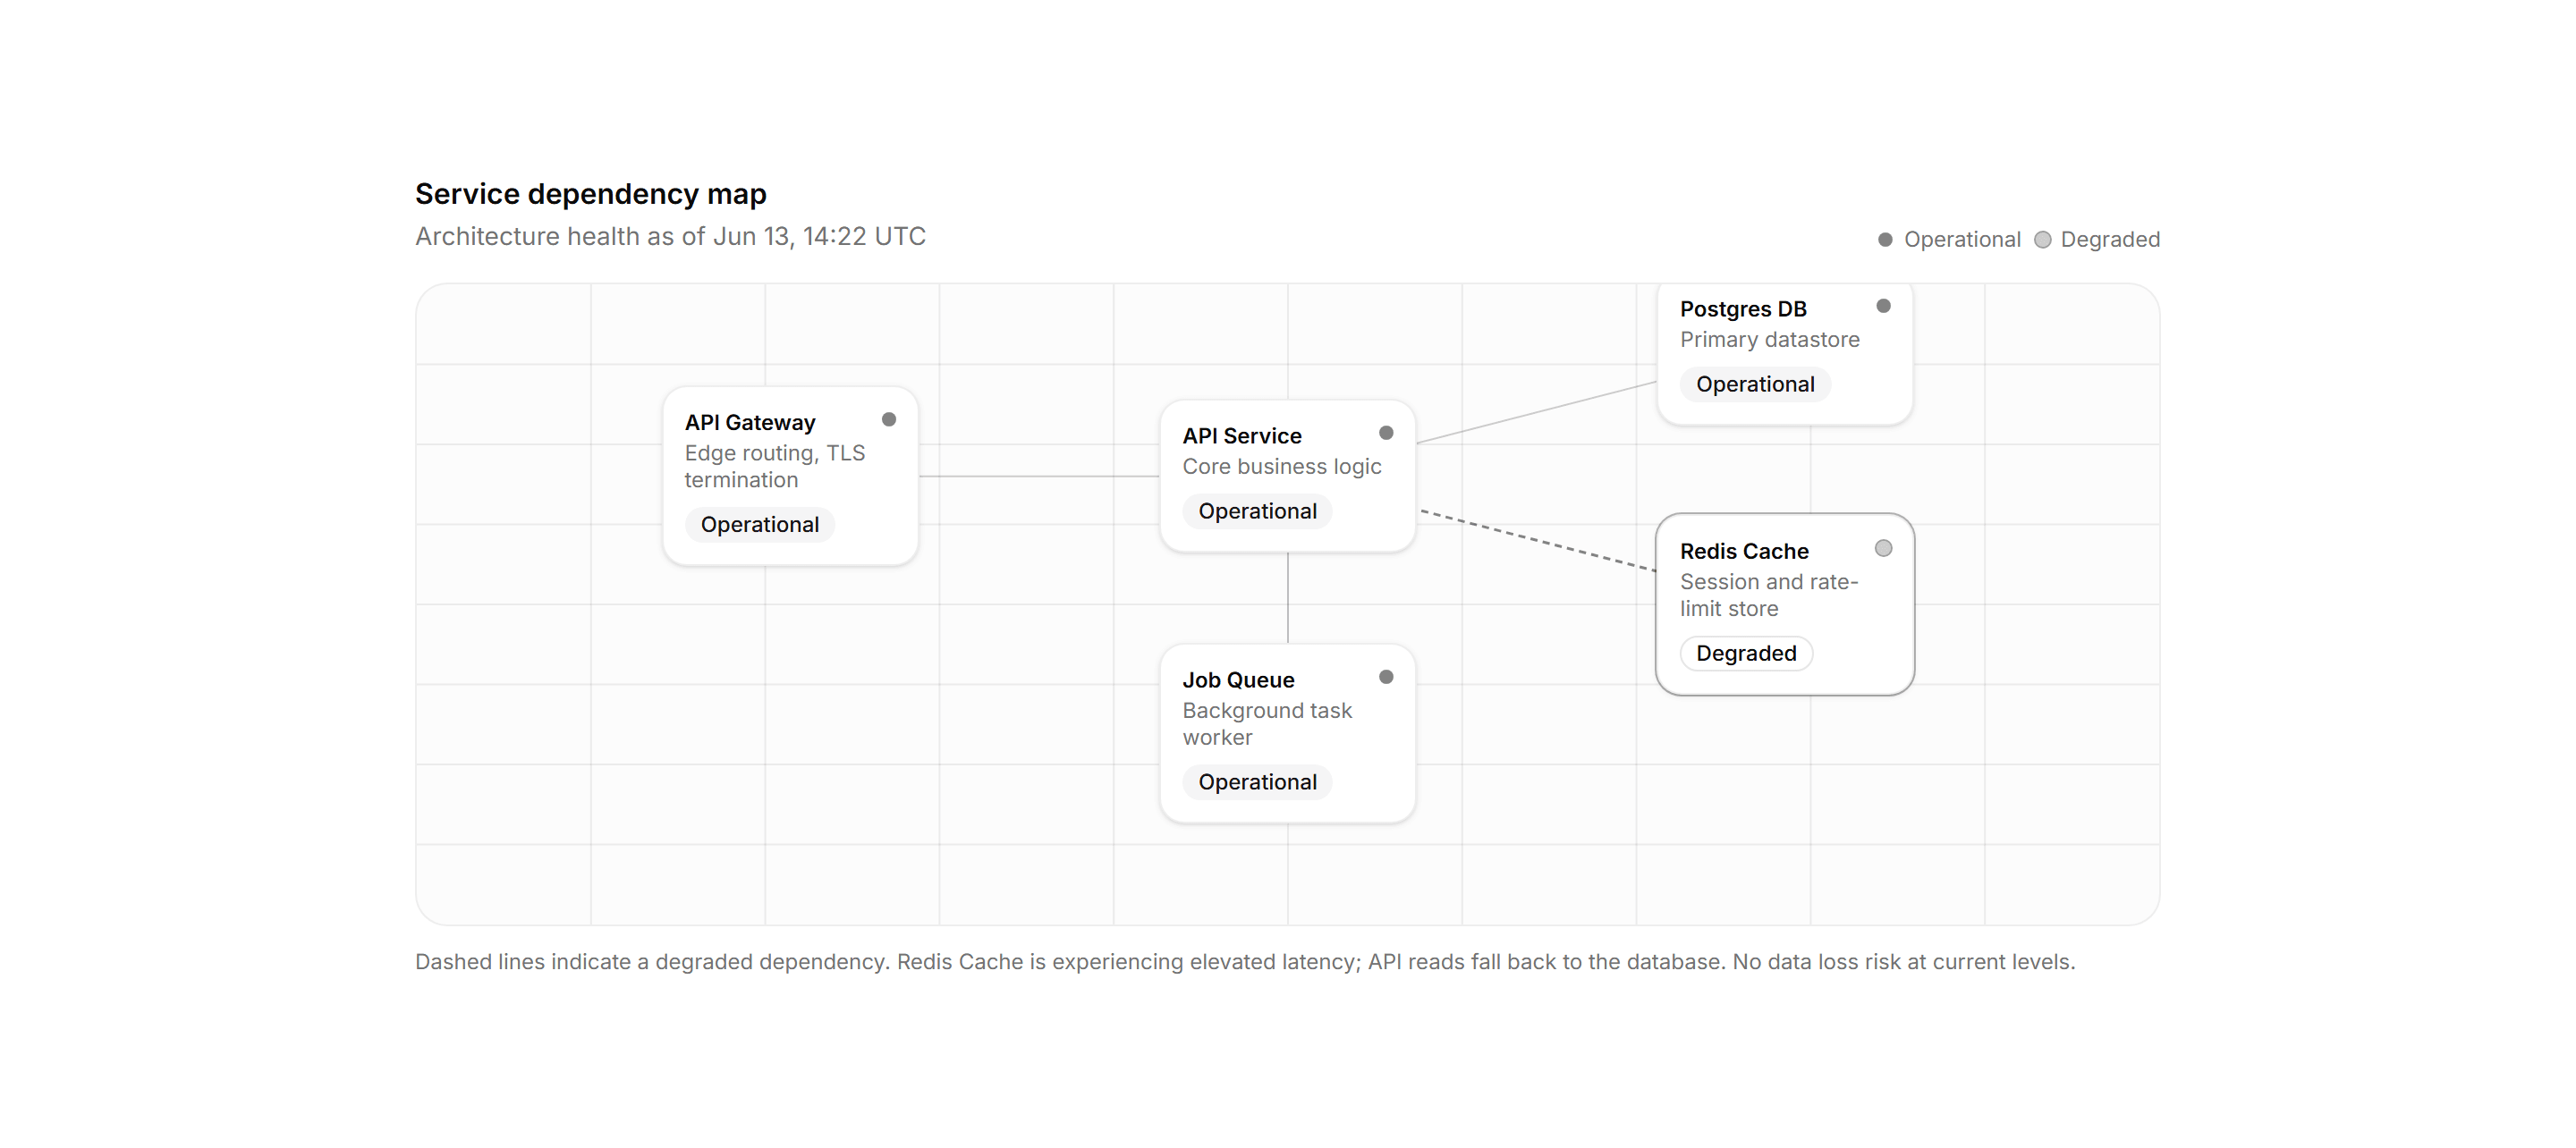
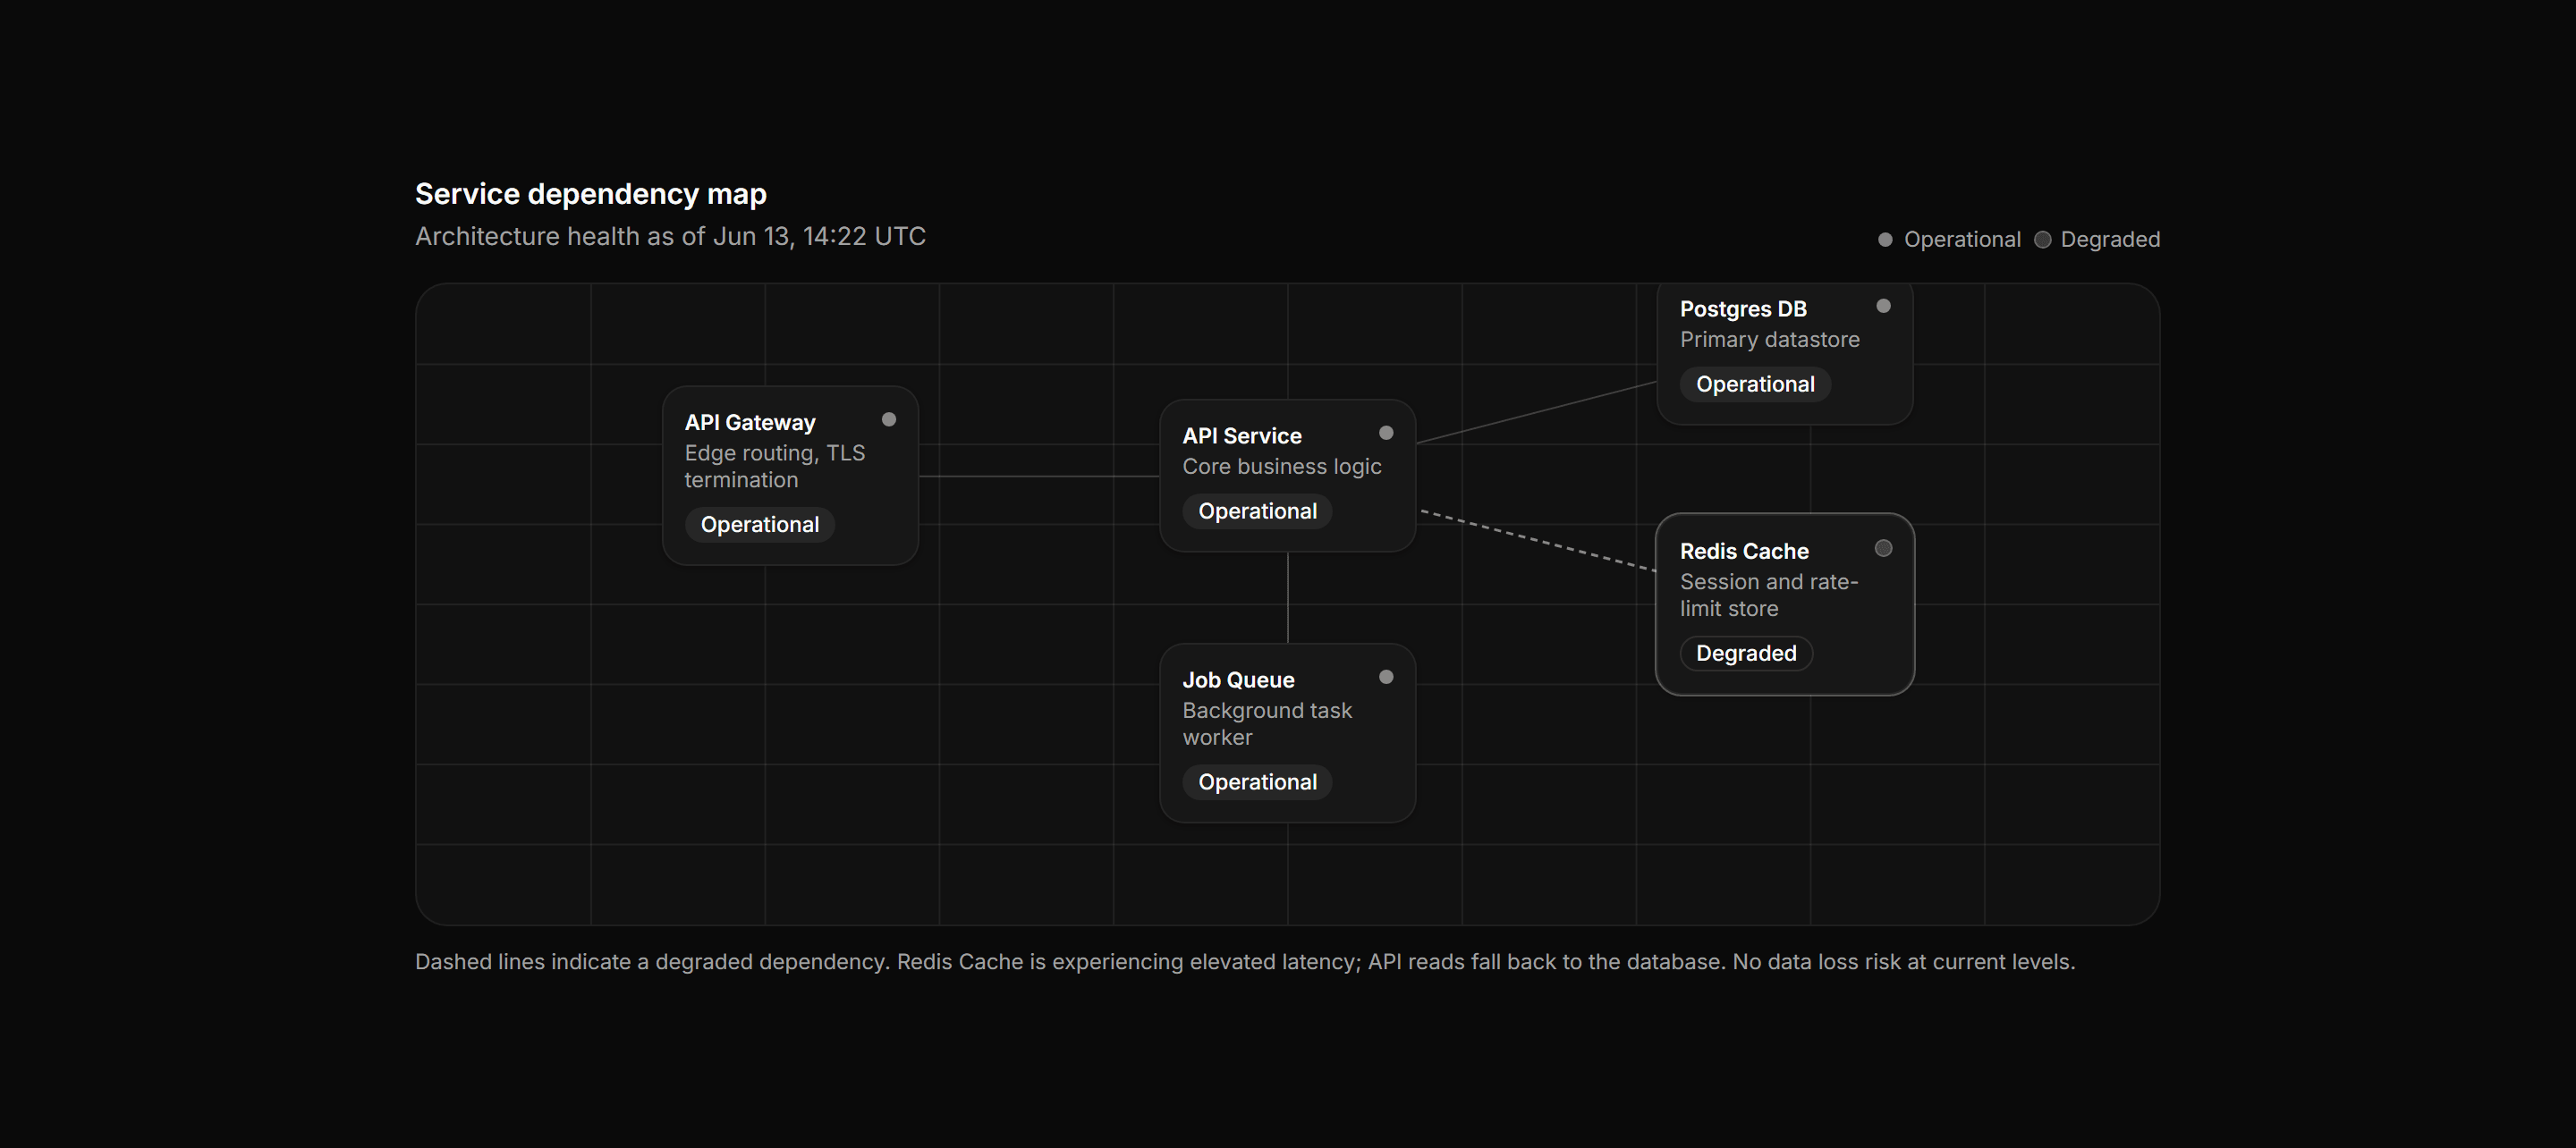
Application Status and Health: Dependency Map Blueprint
Static architecture health map with service nodes on an SVG grid, connecting lines, and a degraded dependency highlighted.
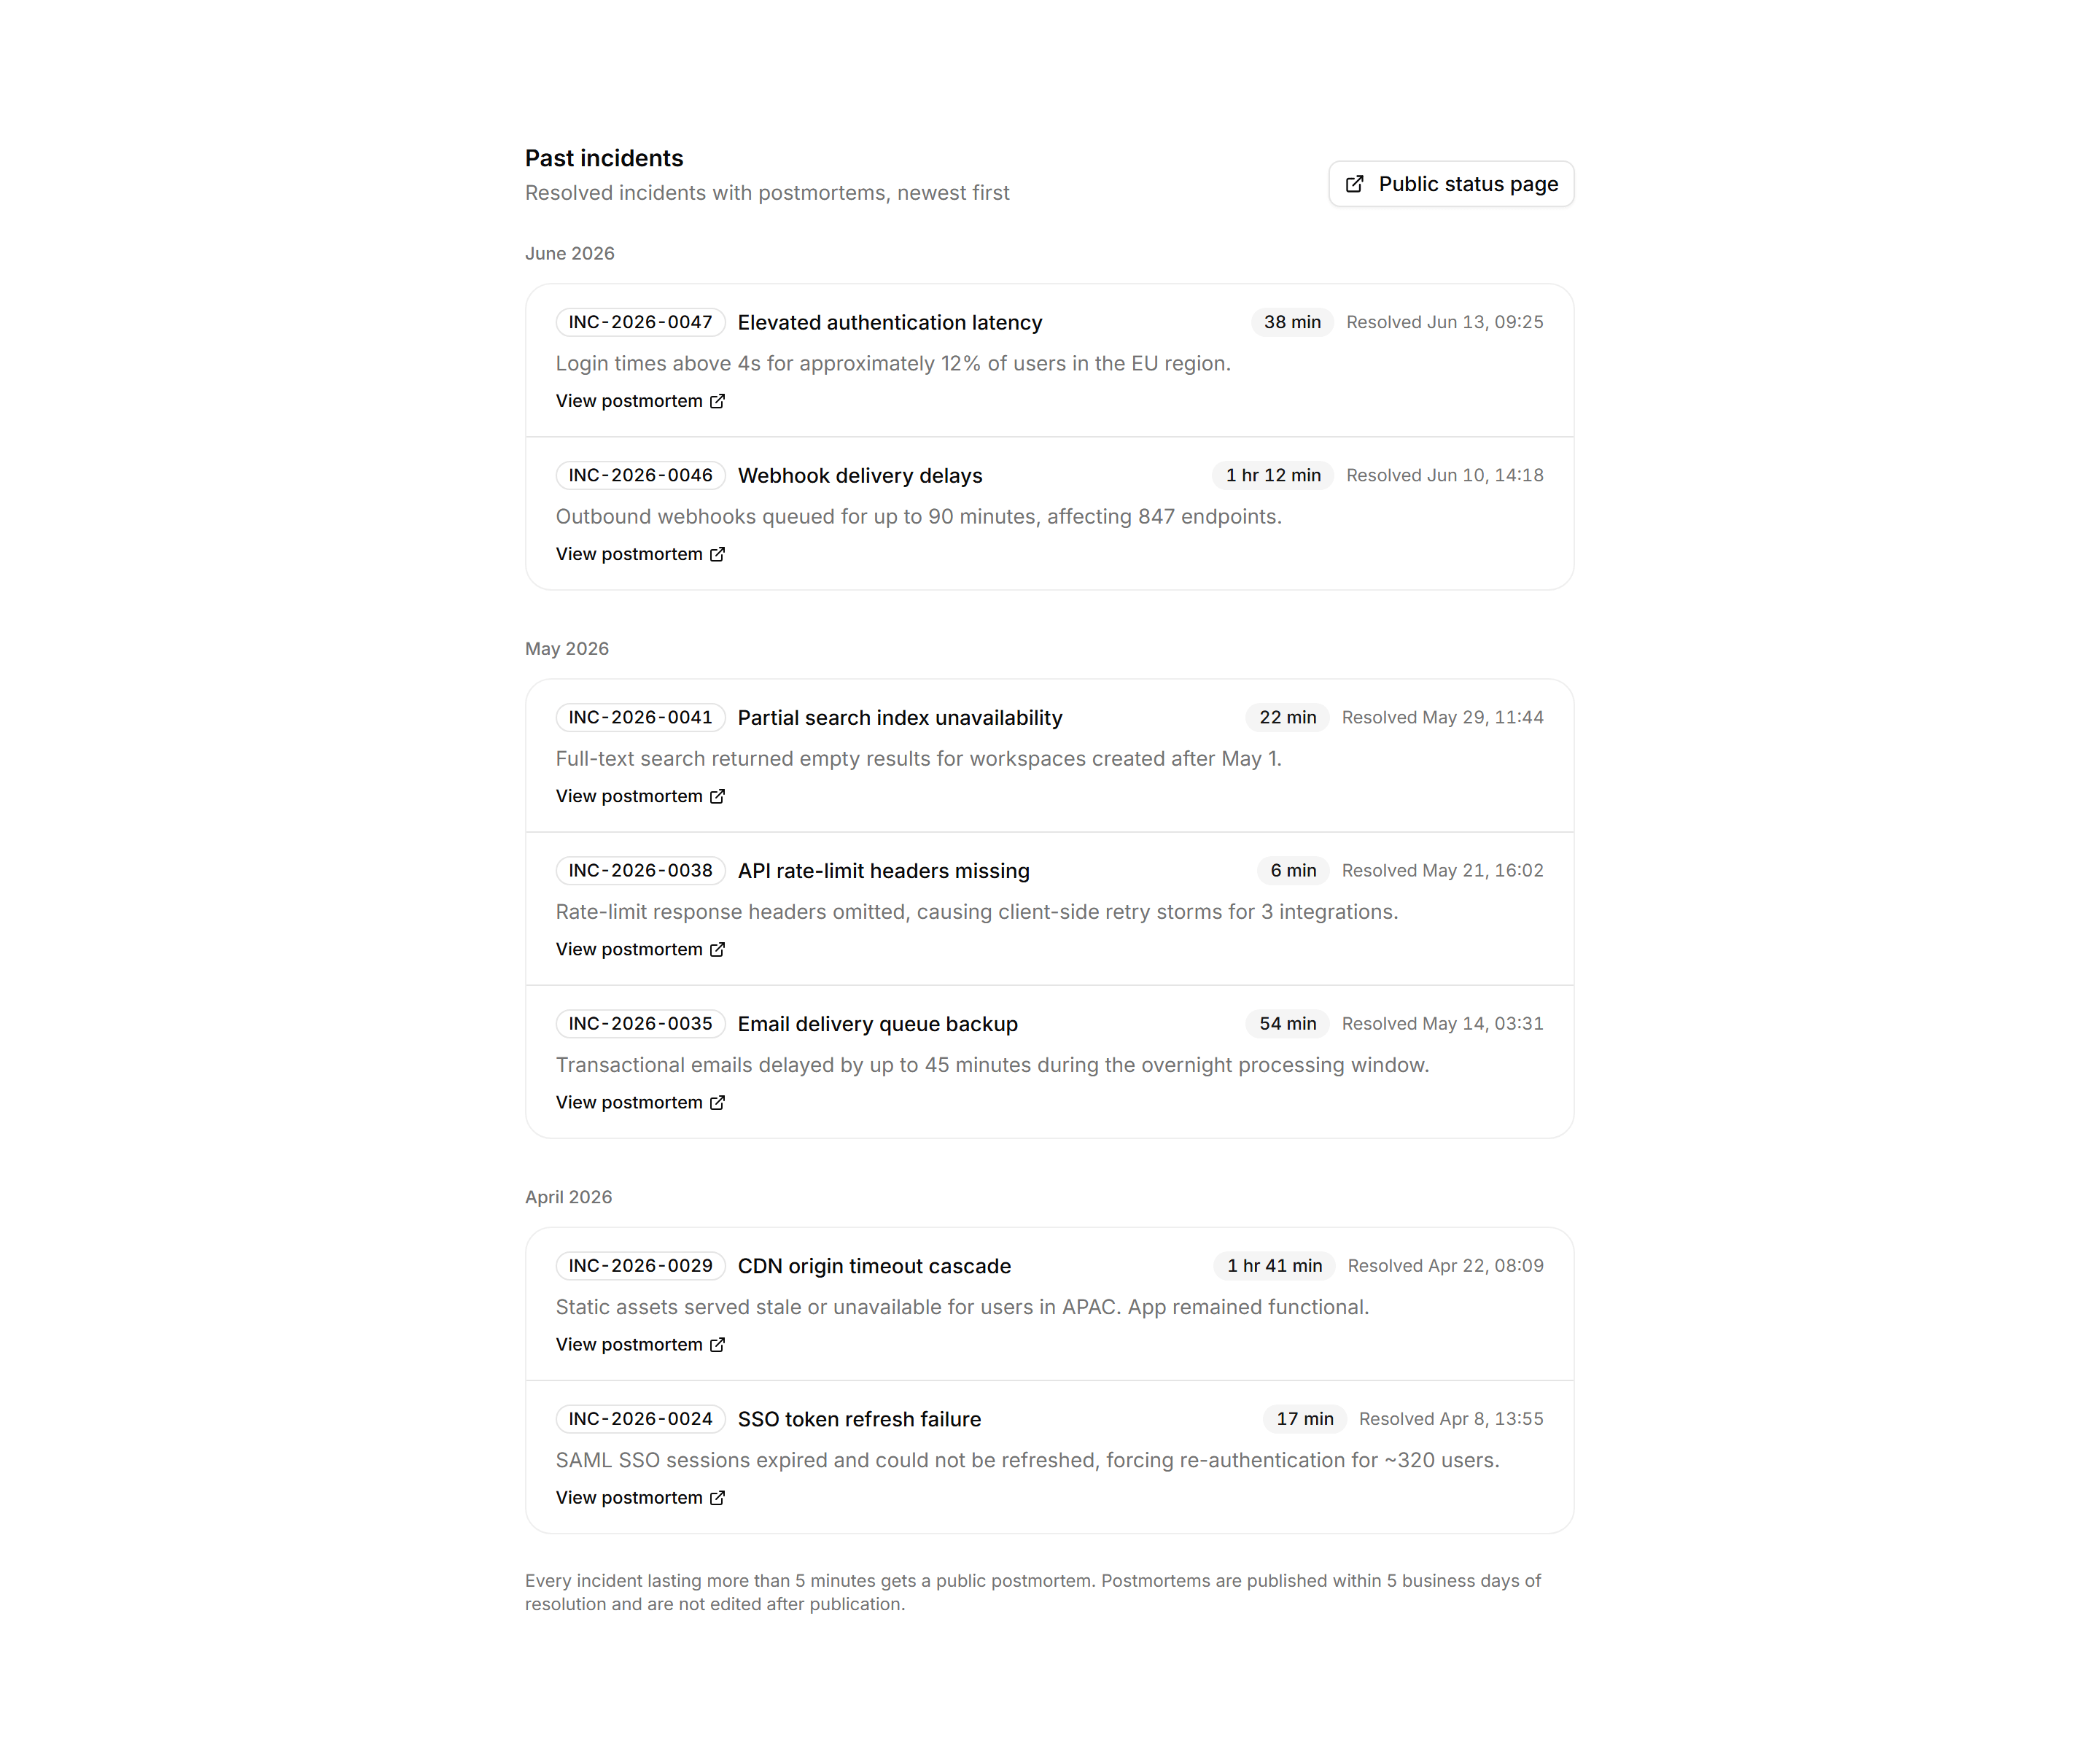
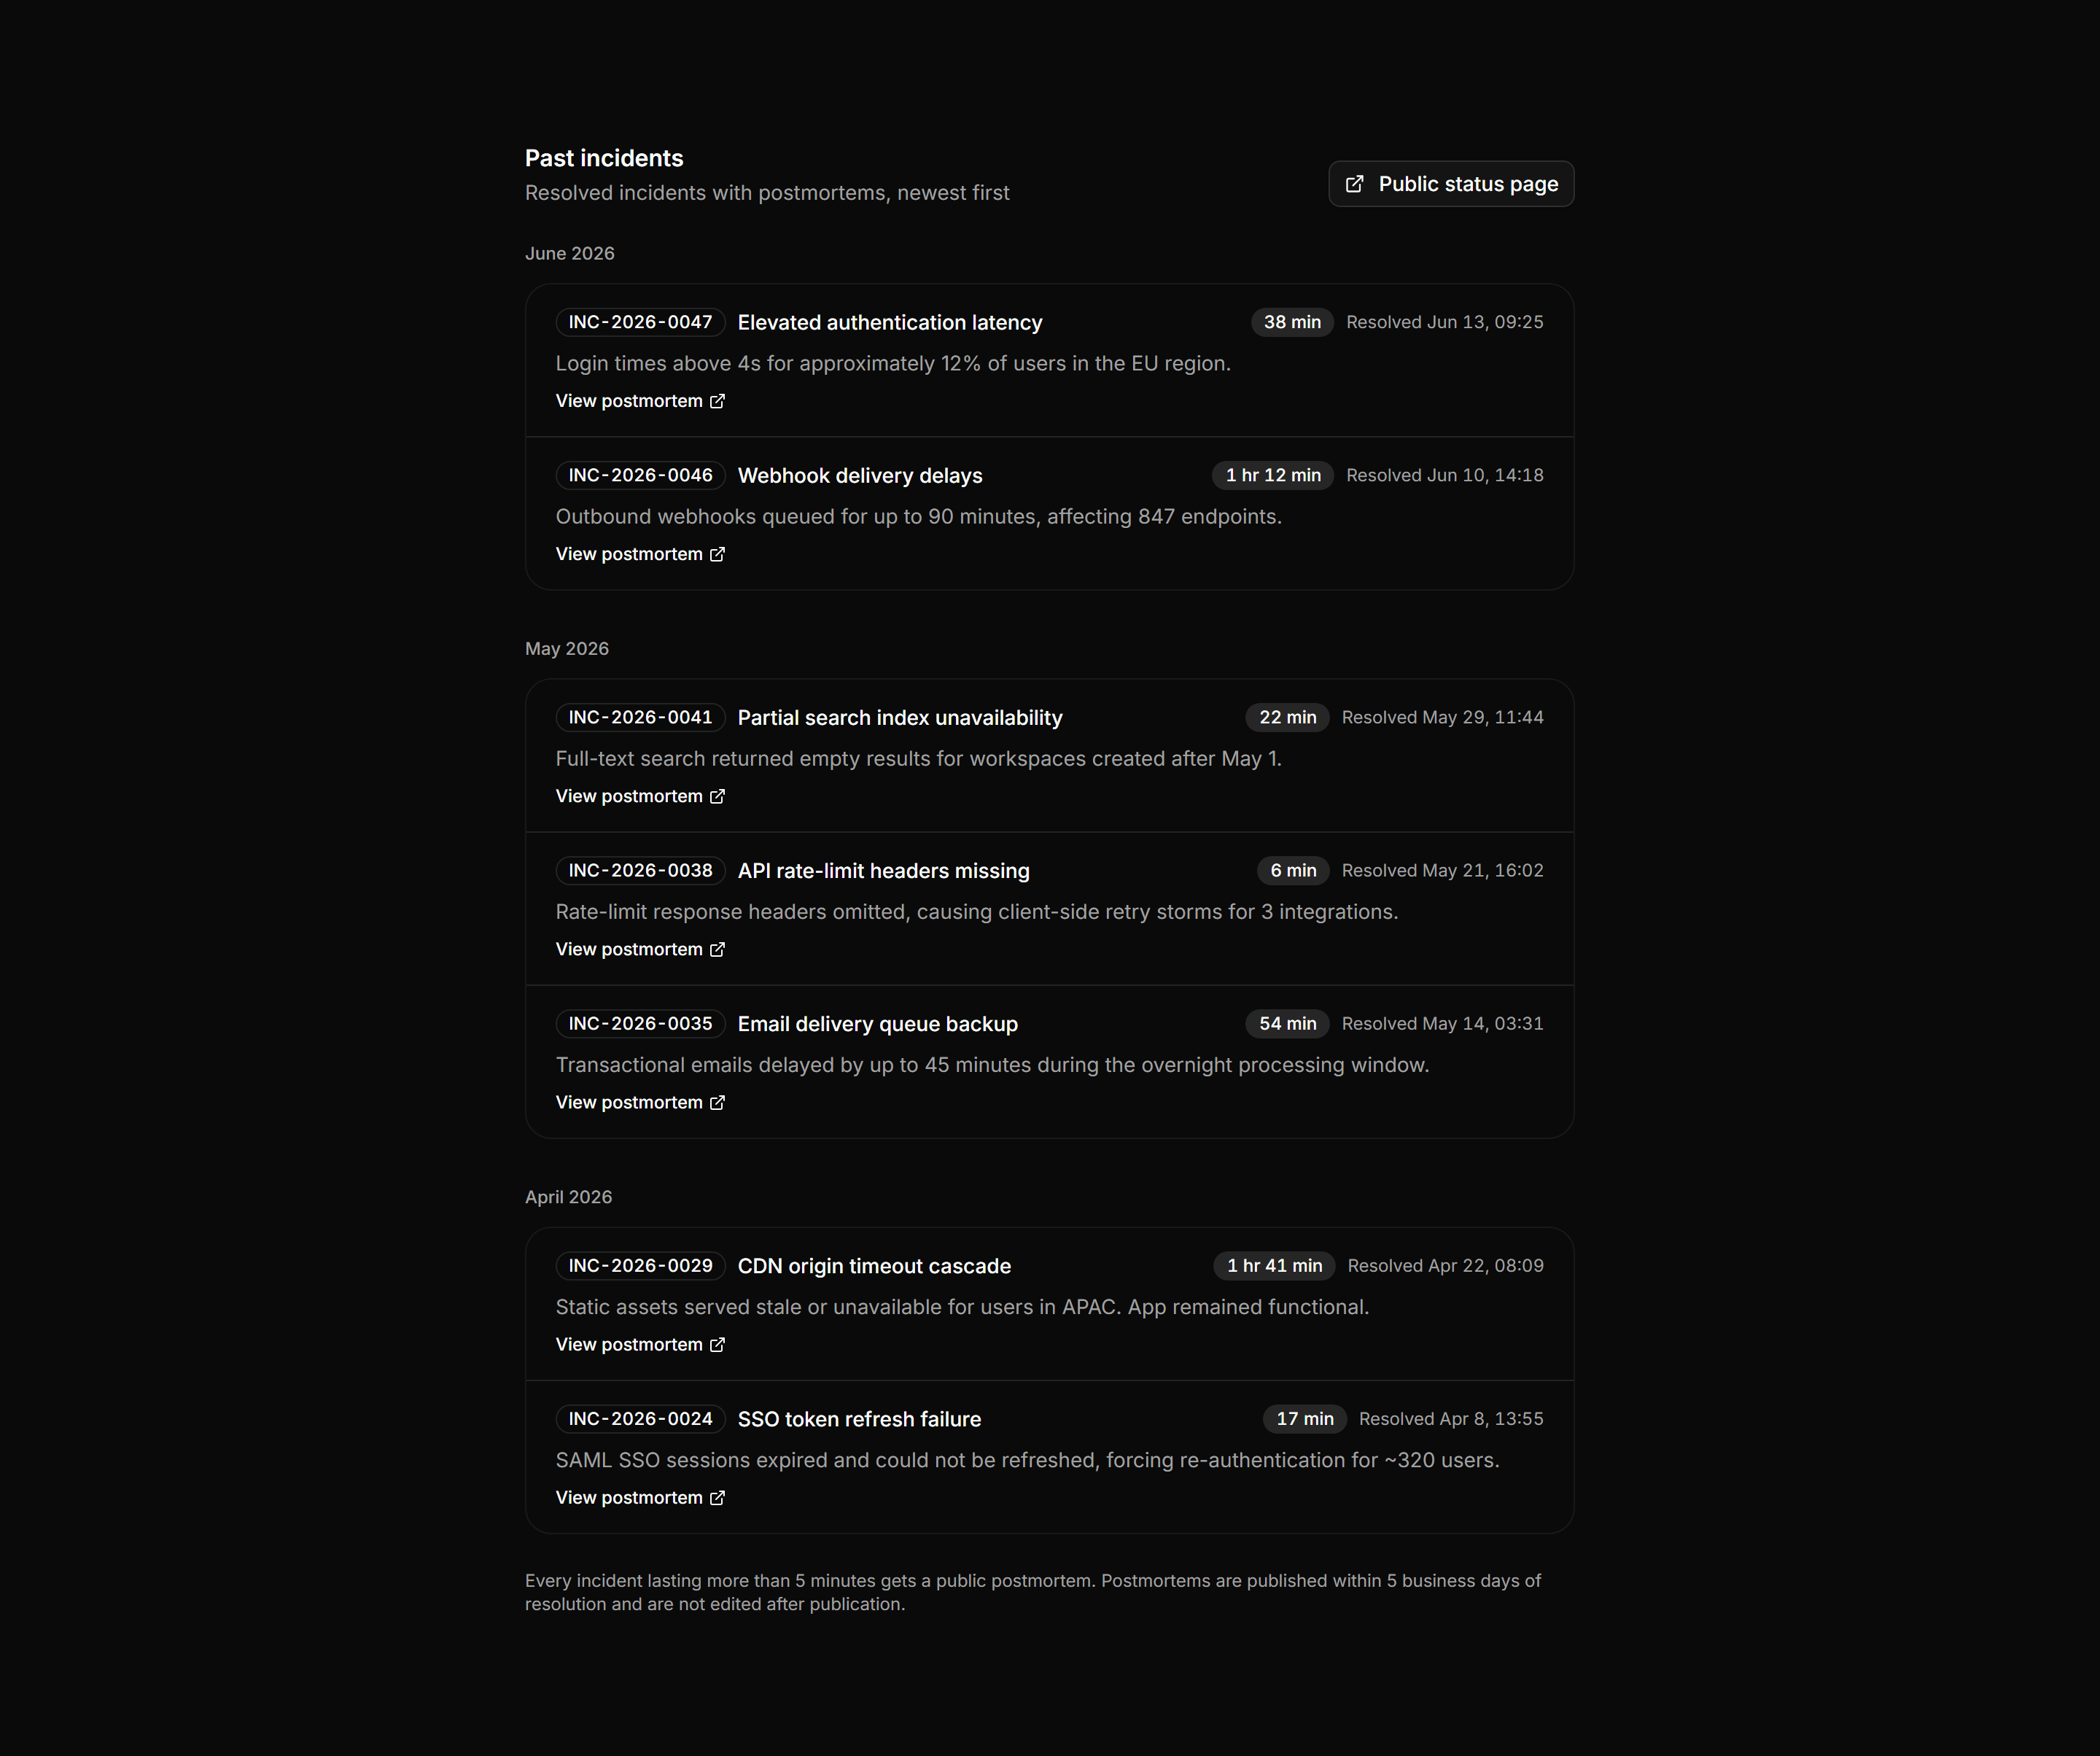
Application Status and Health: Past Incidents List
Resolved incidents grouped by month with duration, impact summary, and a postmortem link per row.
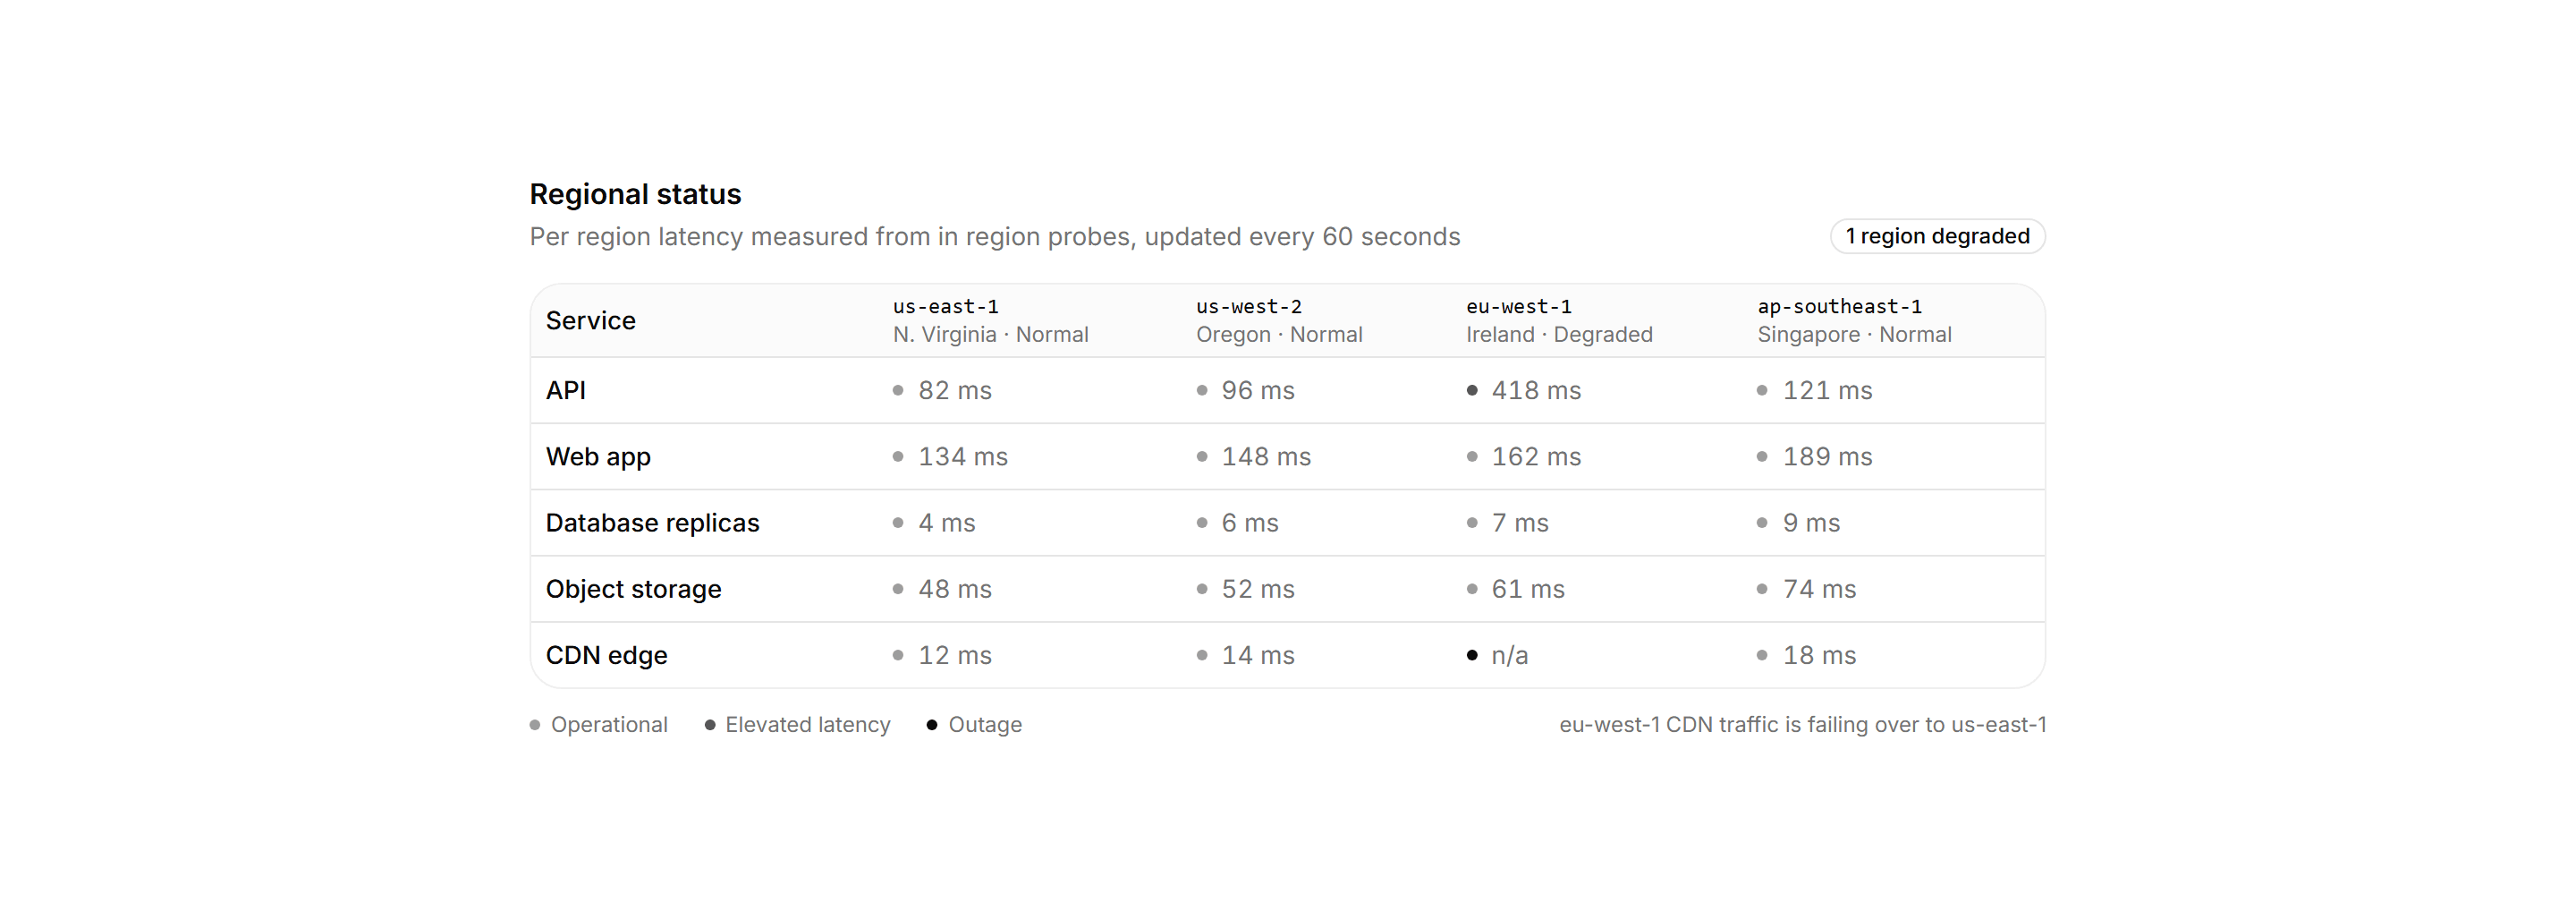
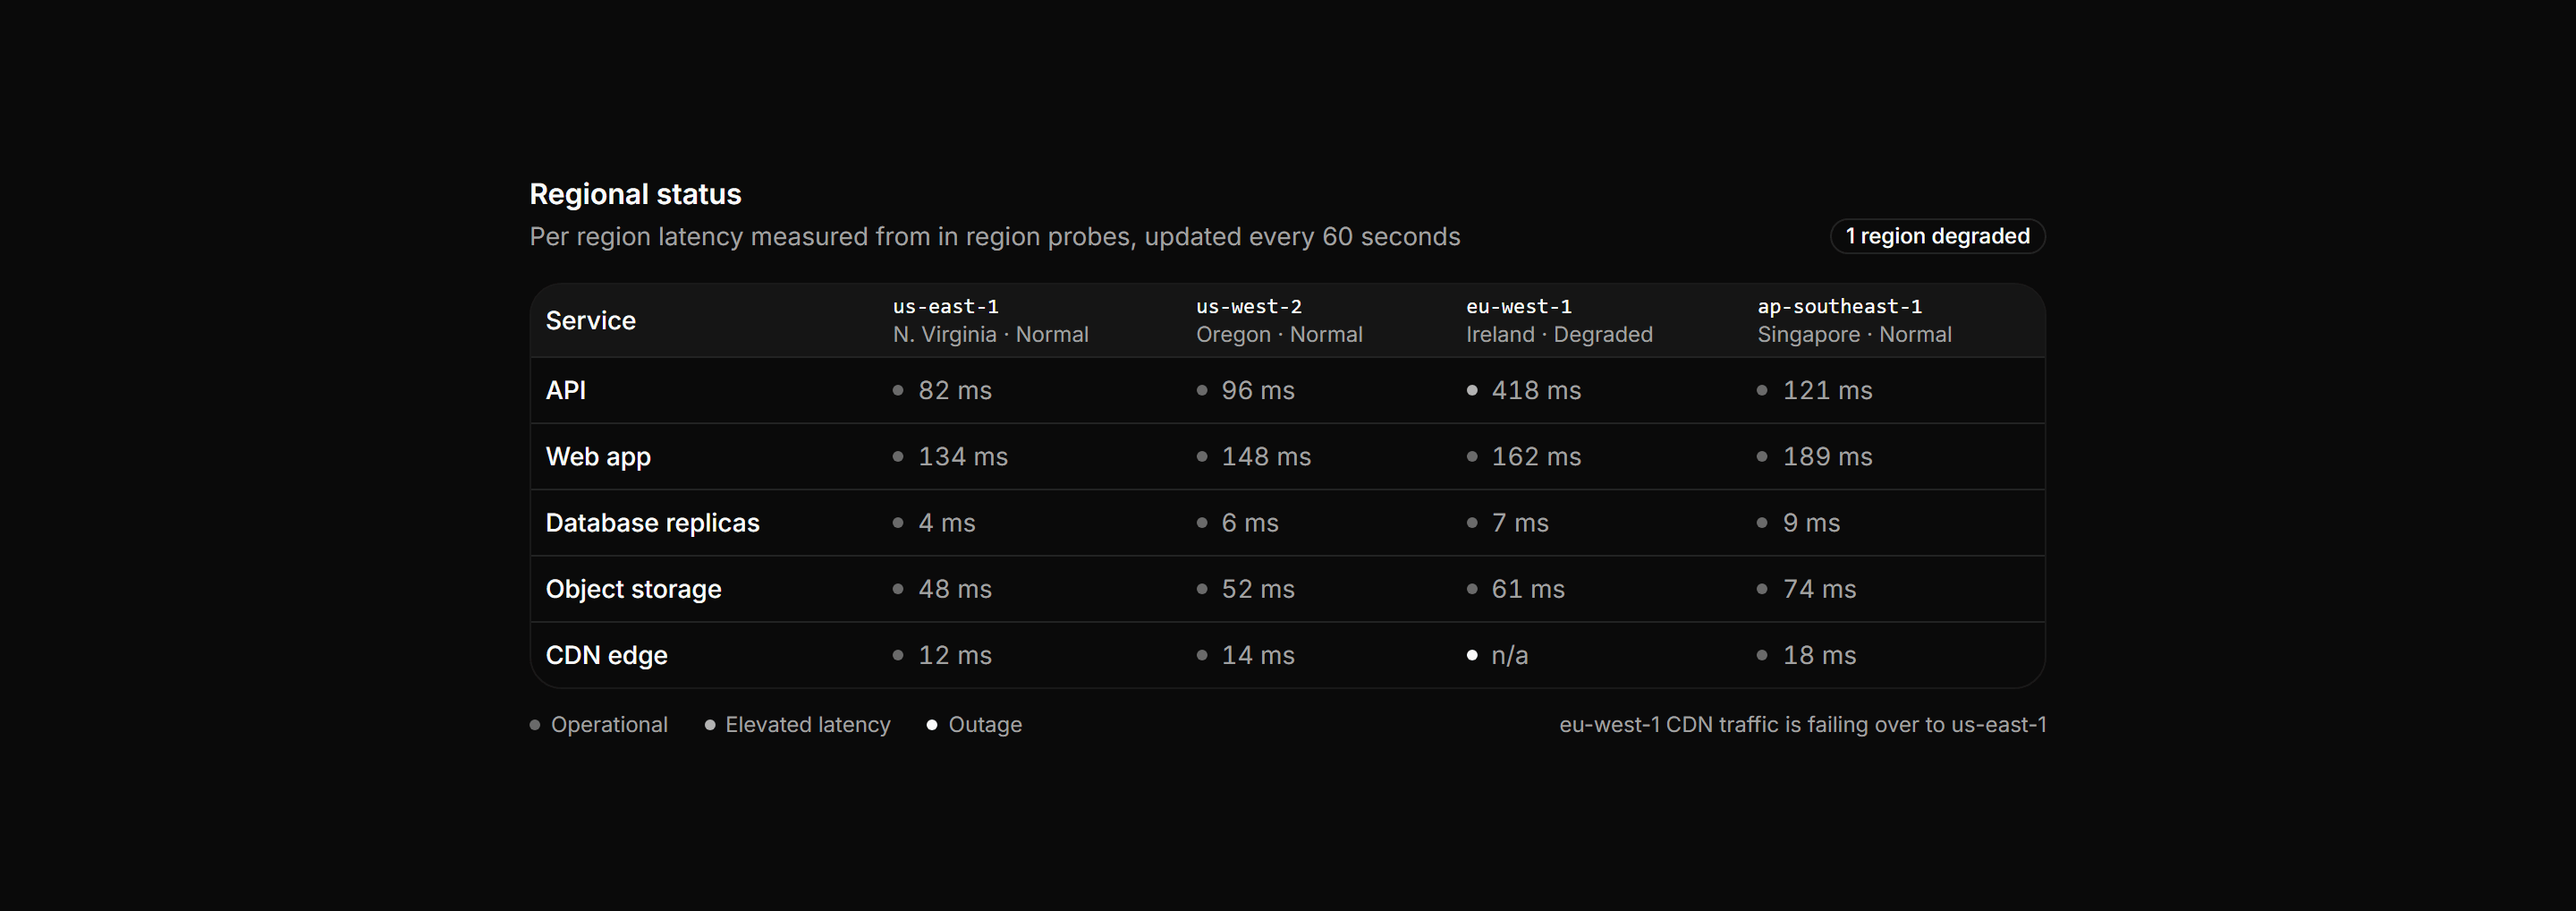
Application Status and Health: Regional Status Matrix
A table matrix with services as rows and four regions as columns, each cell showing a status dot and latency, with a legend below.
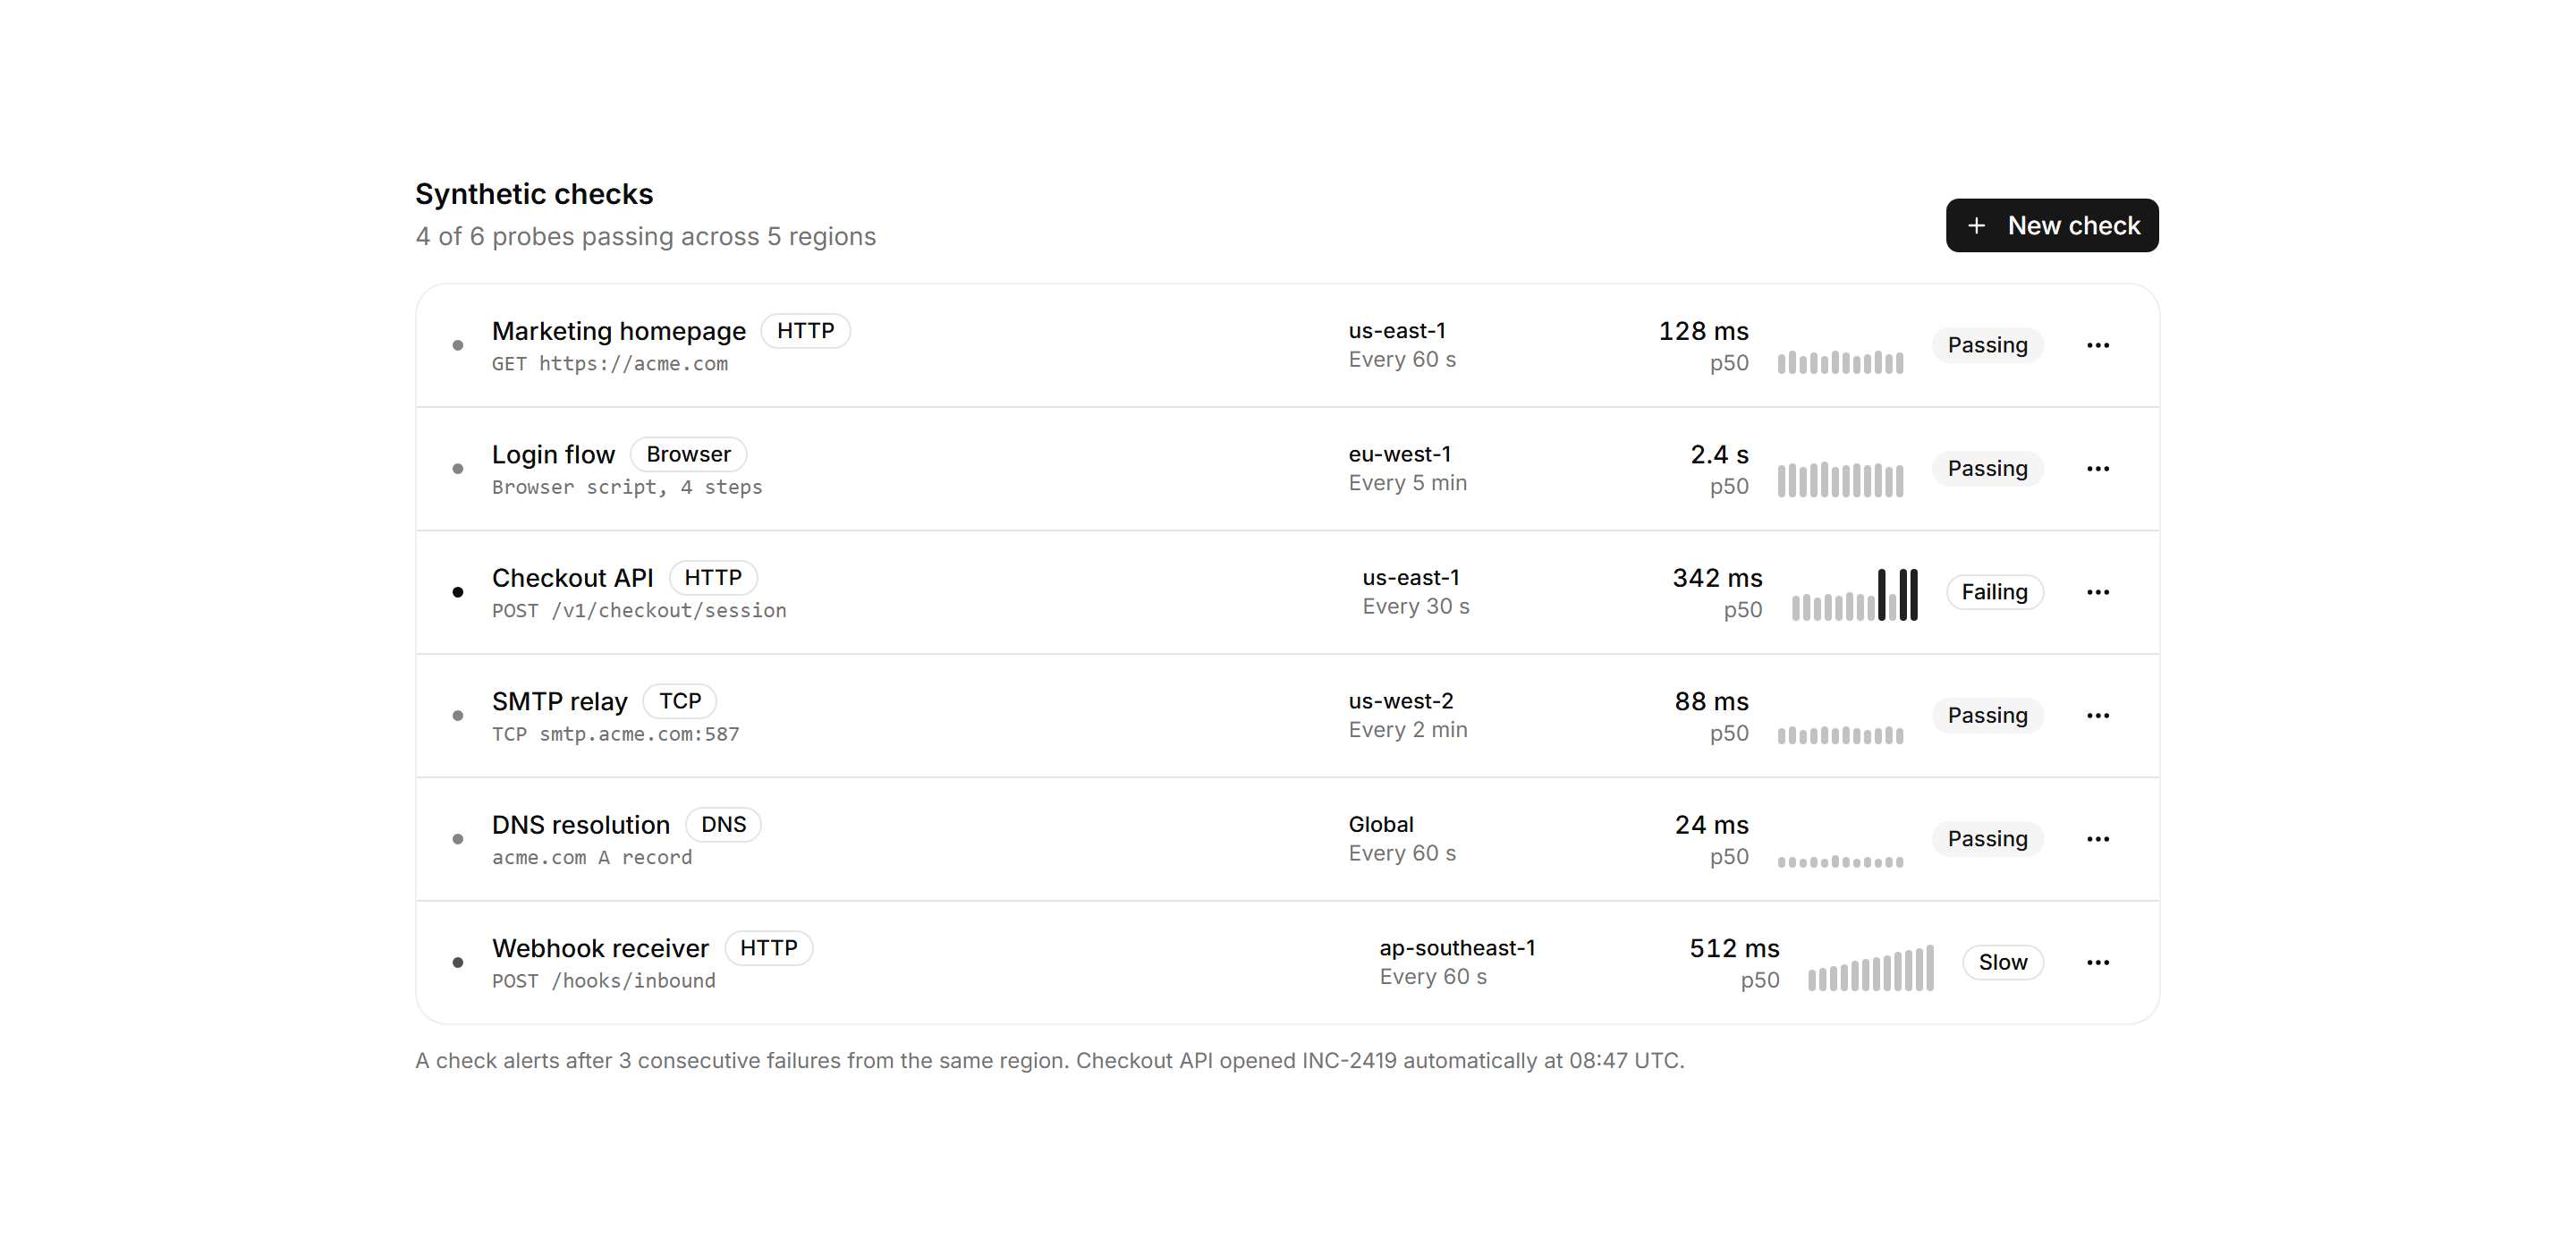
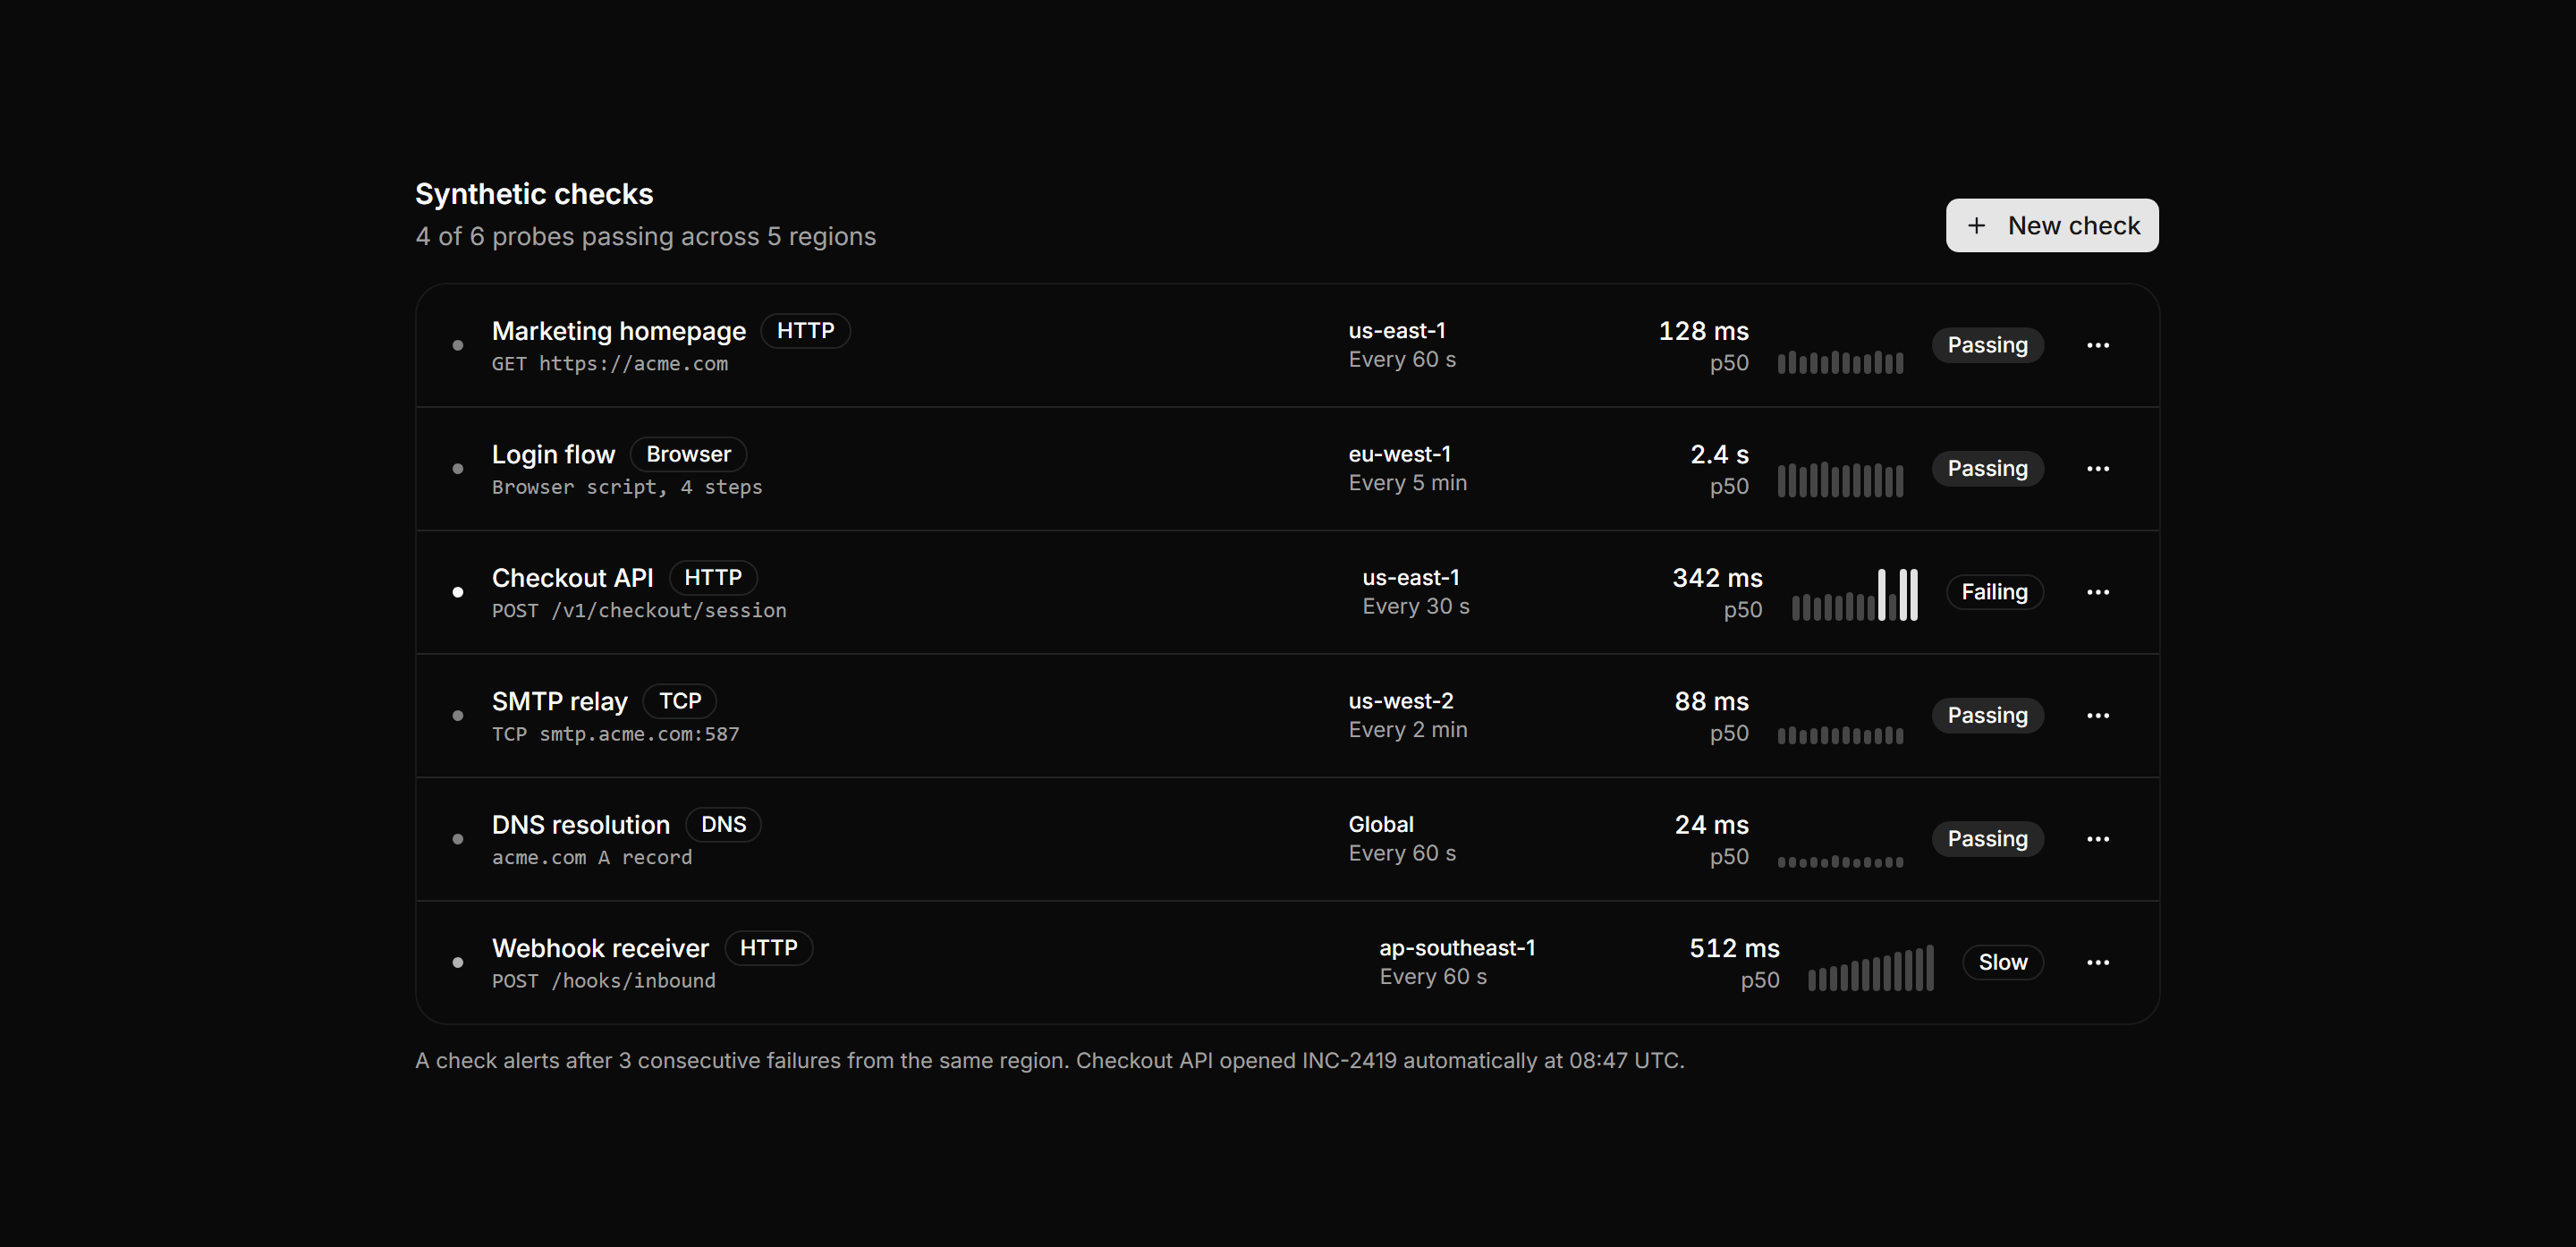
Application Status and Health: Synthetic Checks Panel
A panel listing probe rows, each with a status dot, check name and target, type badge, region, interval, median latency, and a run result strip.
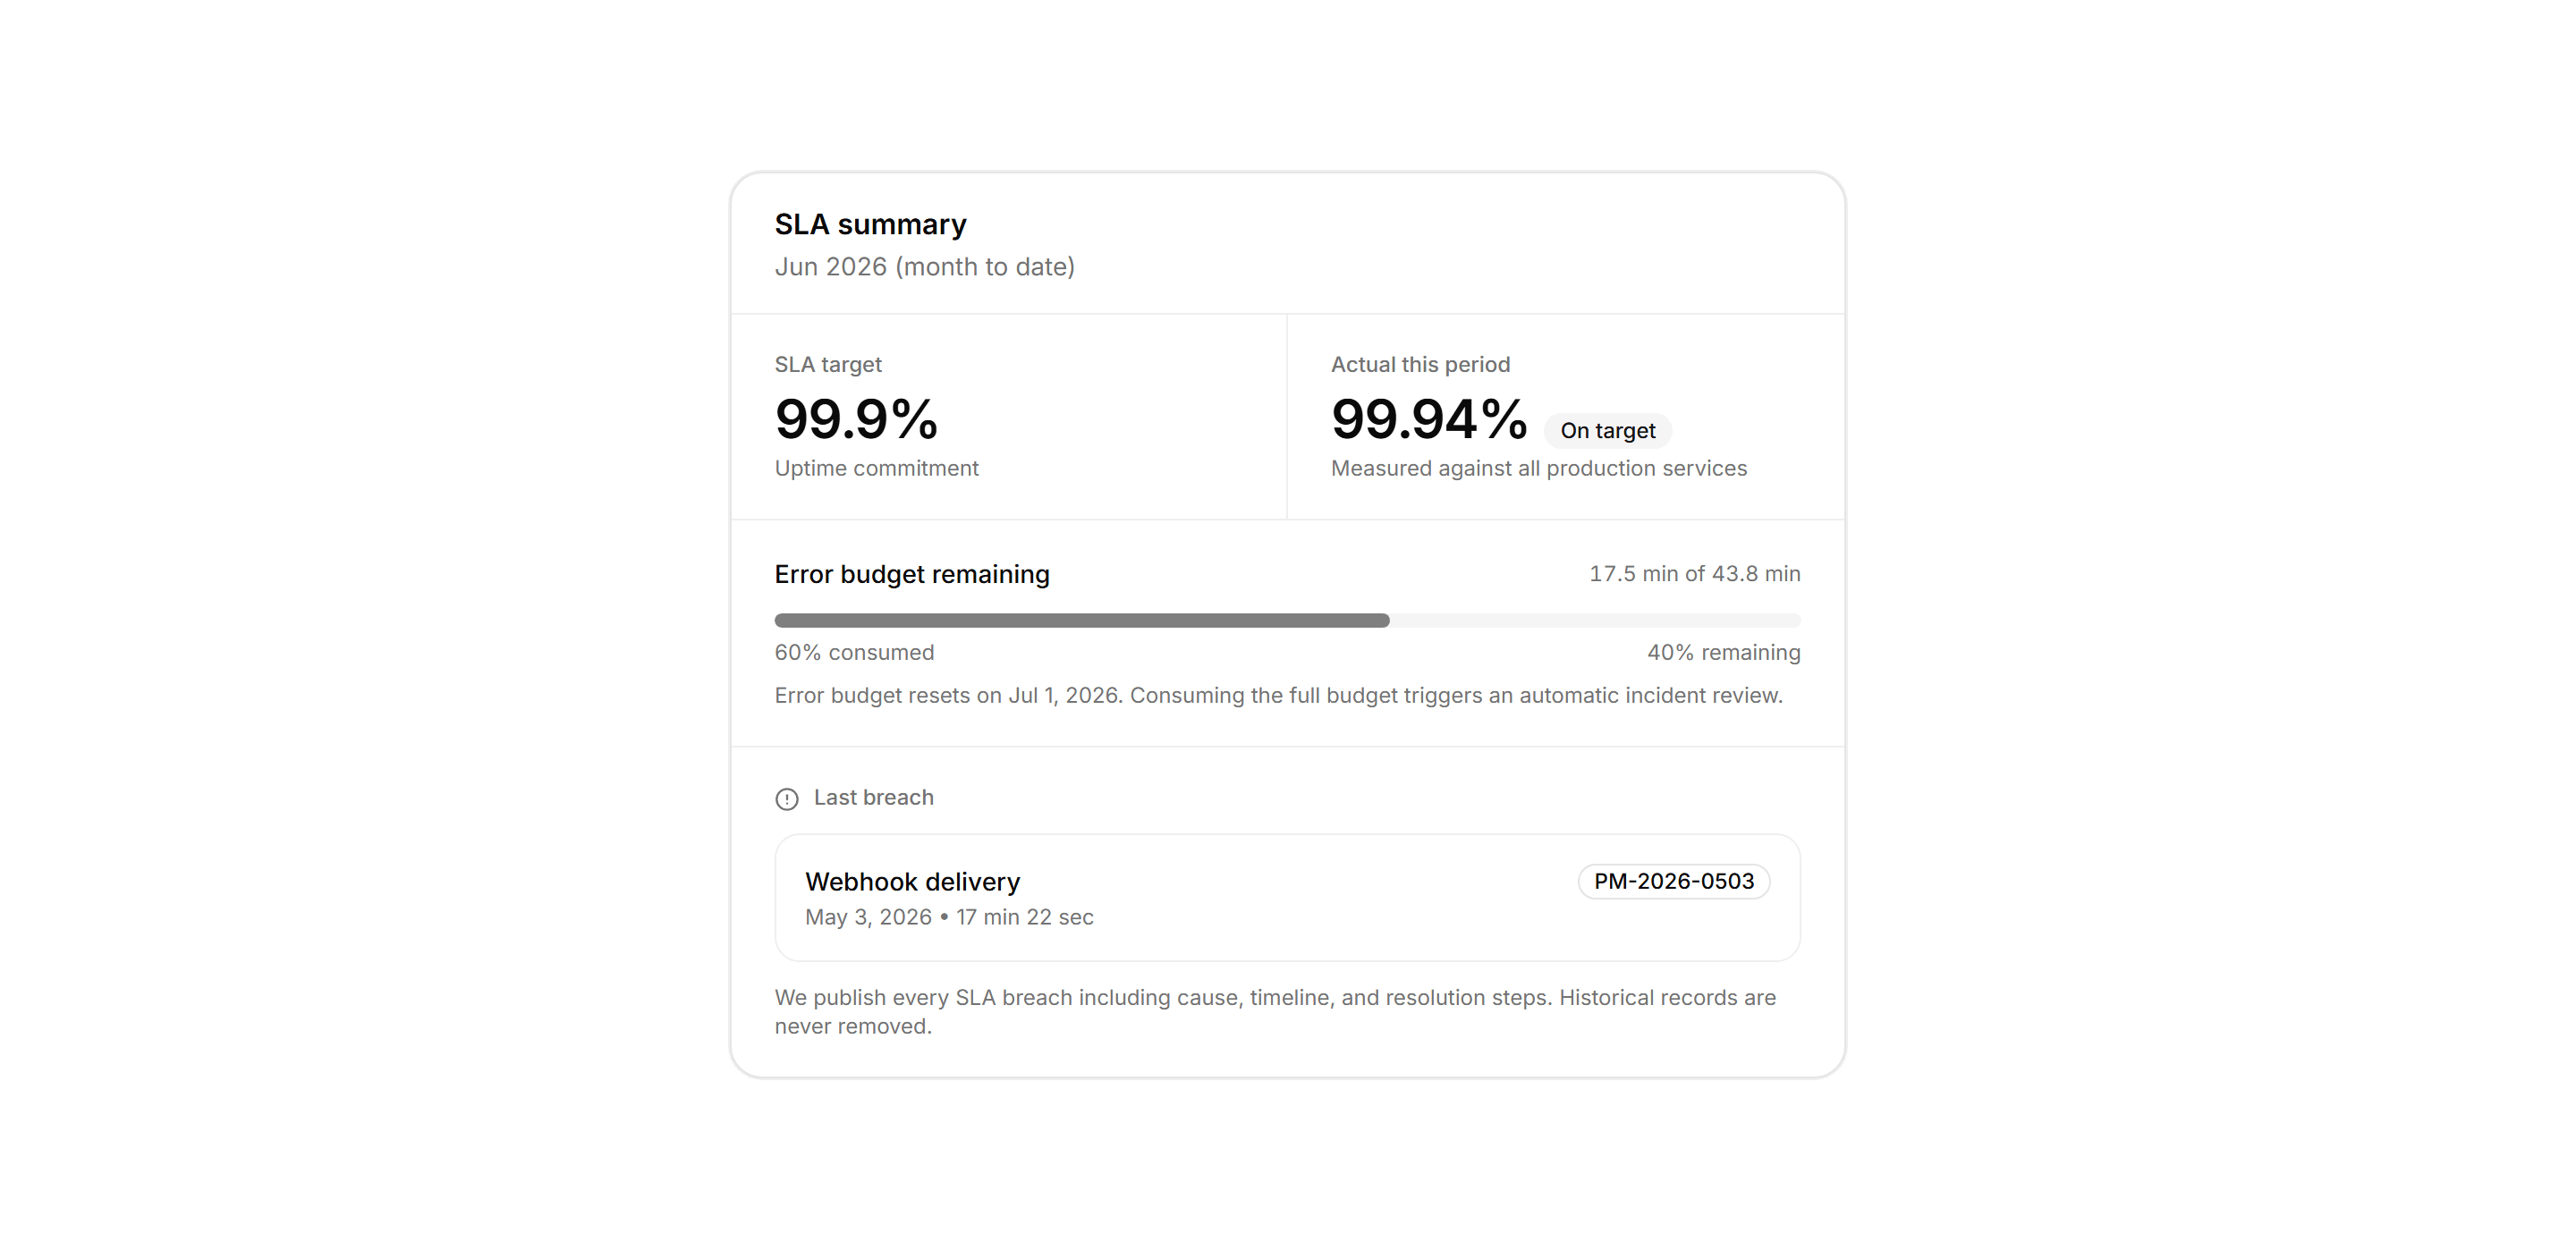
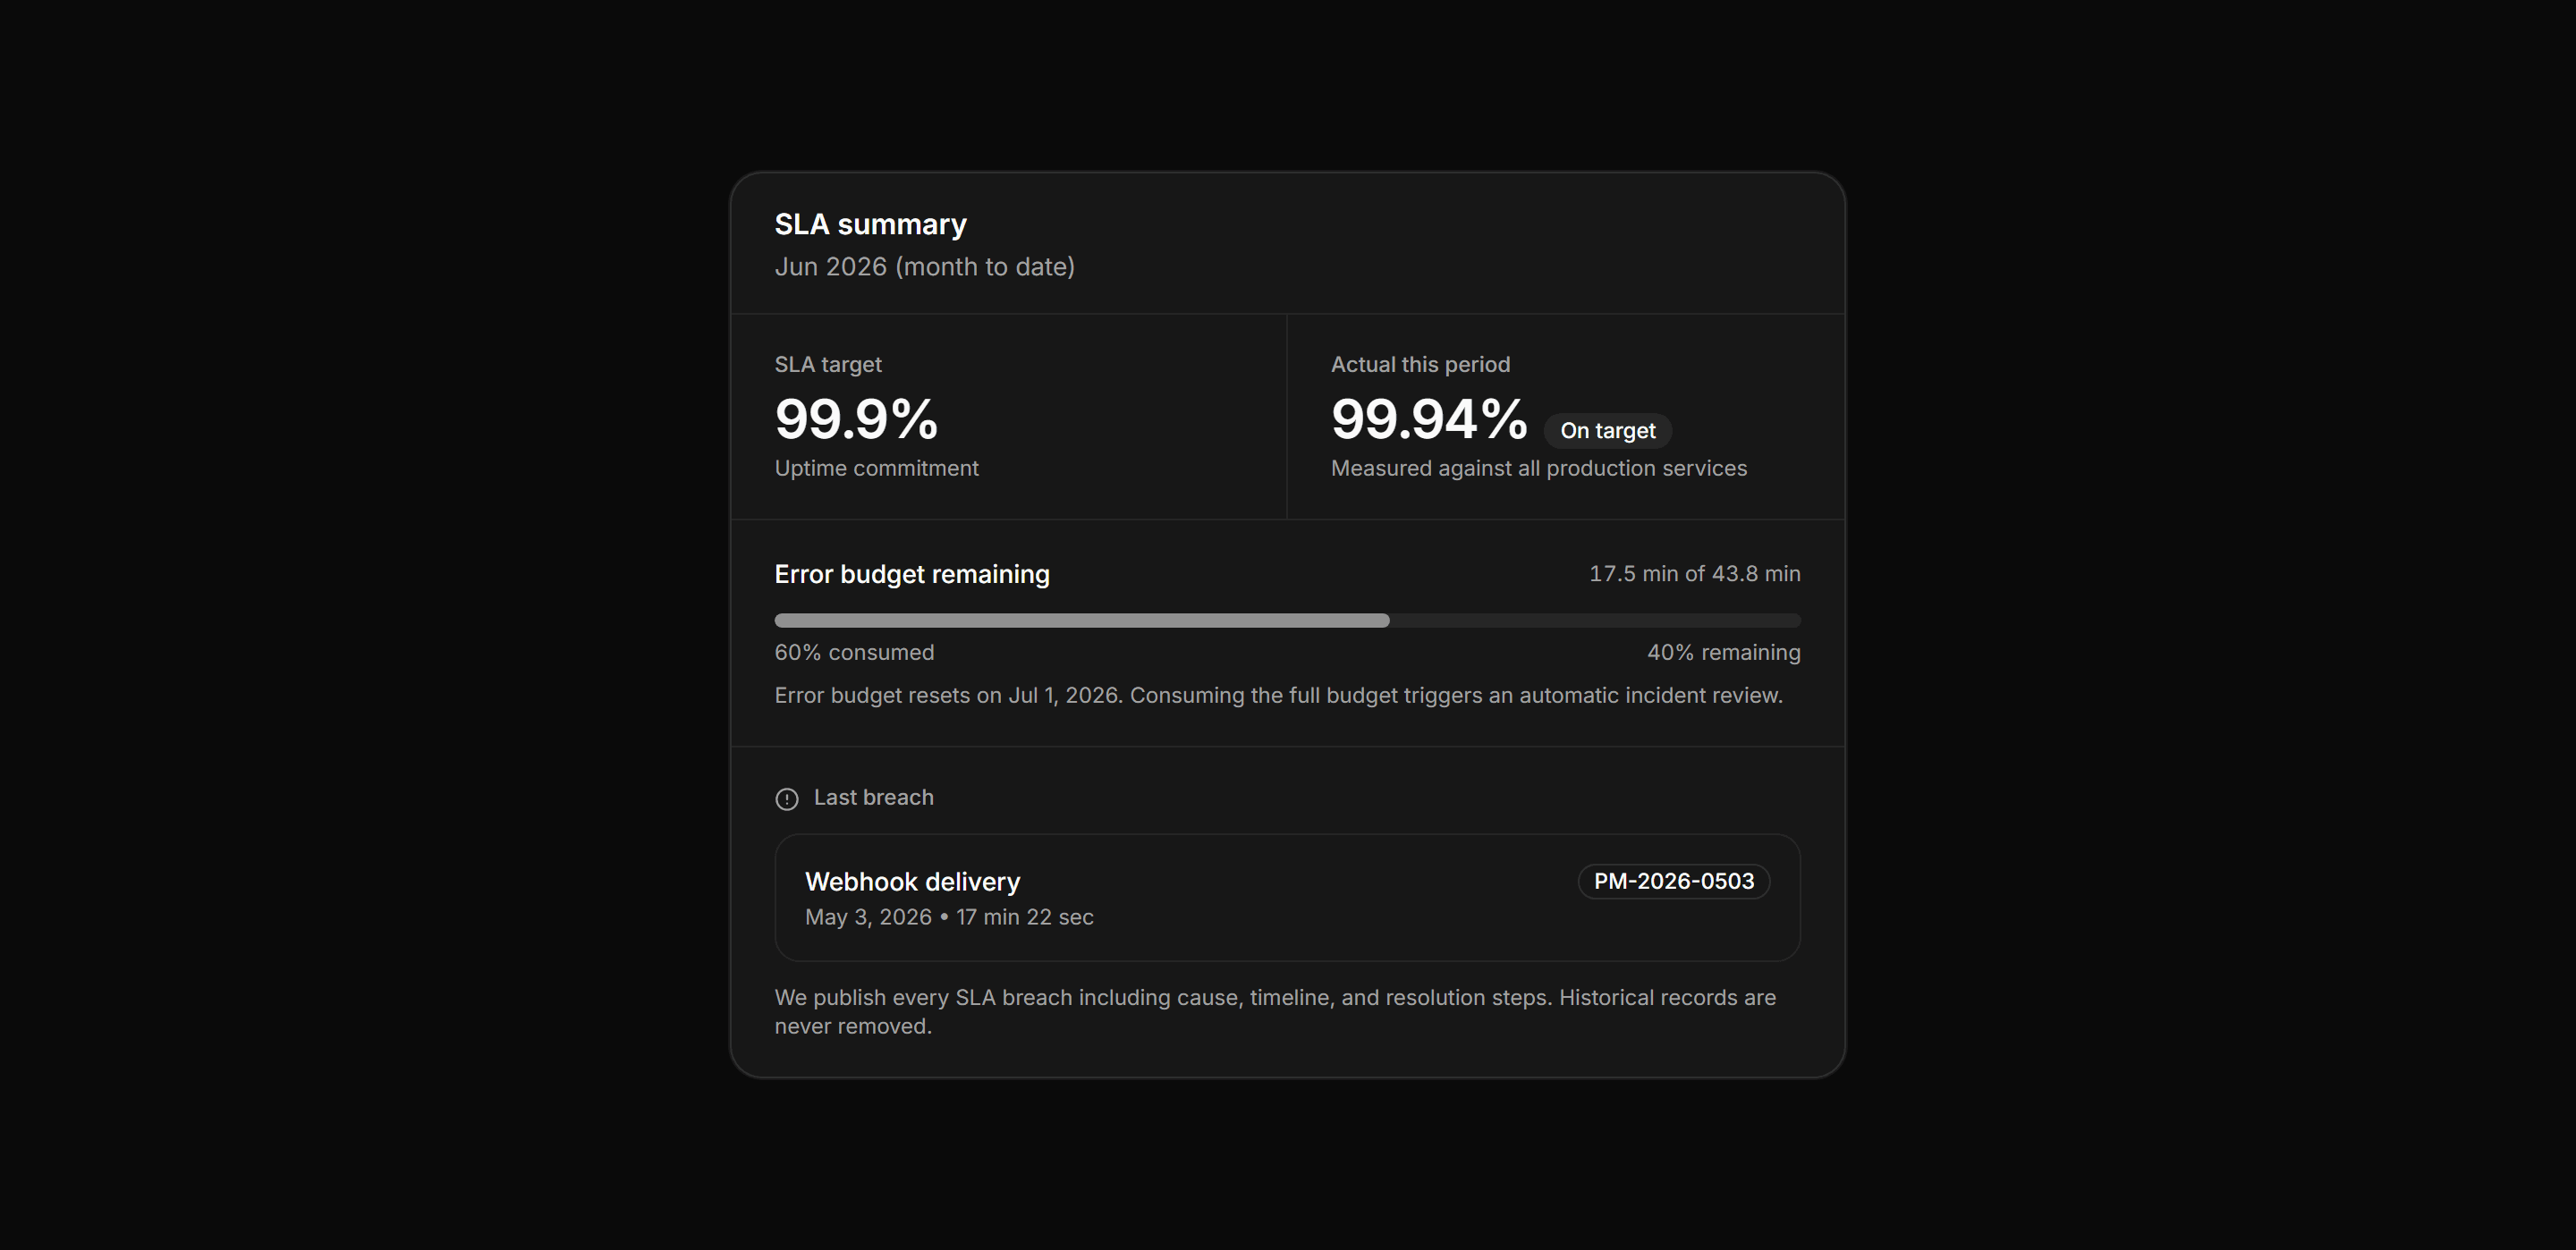
Application Status and Health: Sla Summary Card
SLA card showing the uptime target, actual this period, error budget bar, and the last published breach record.
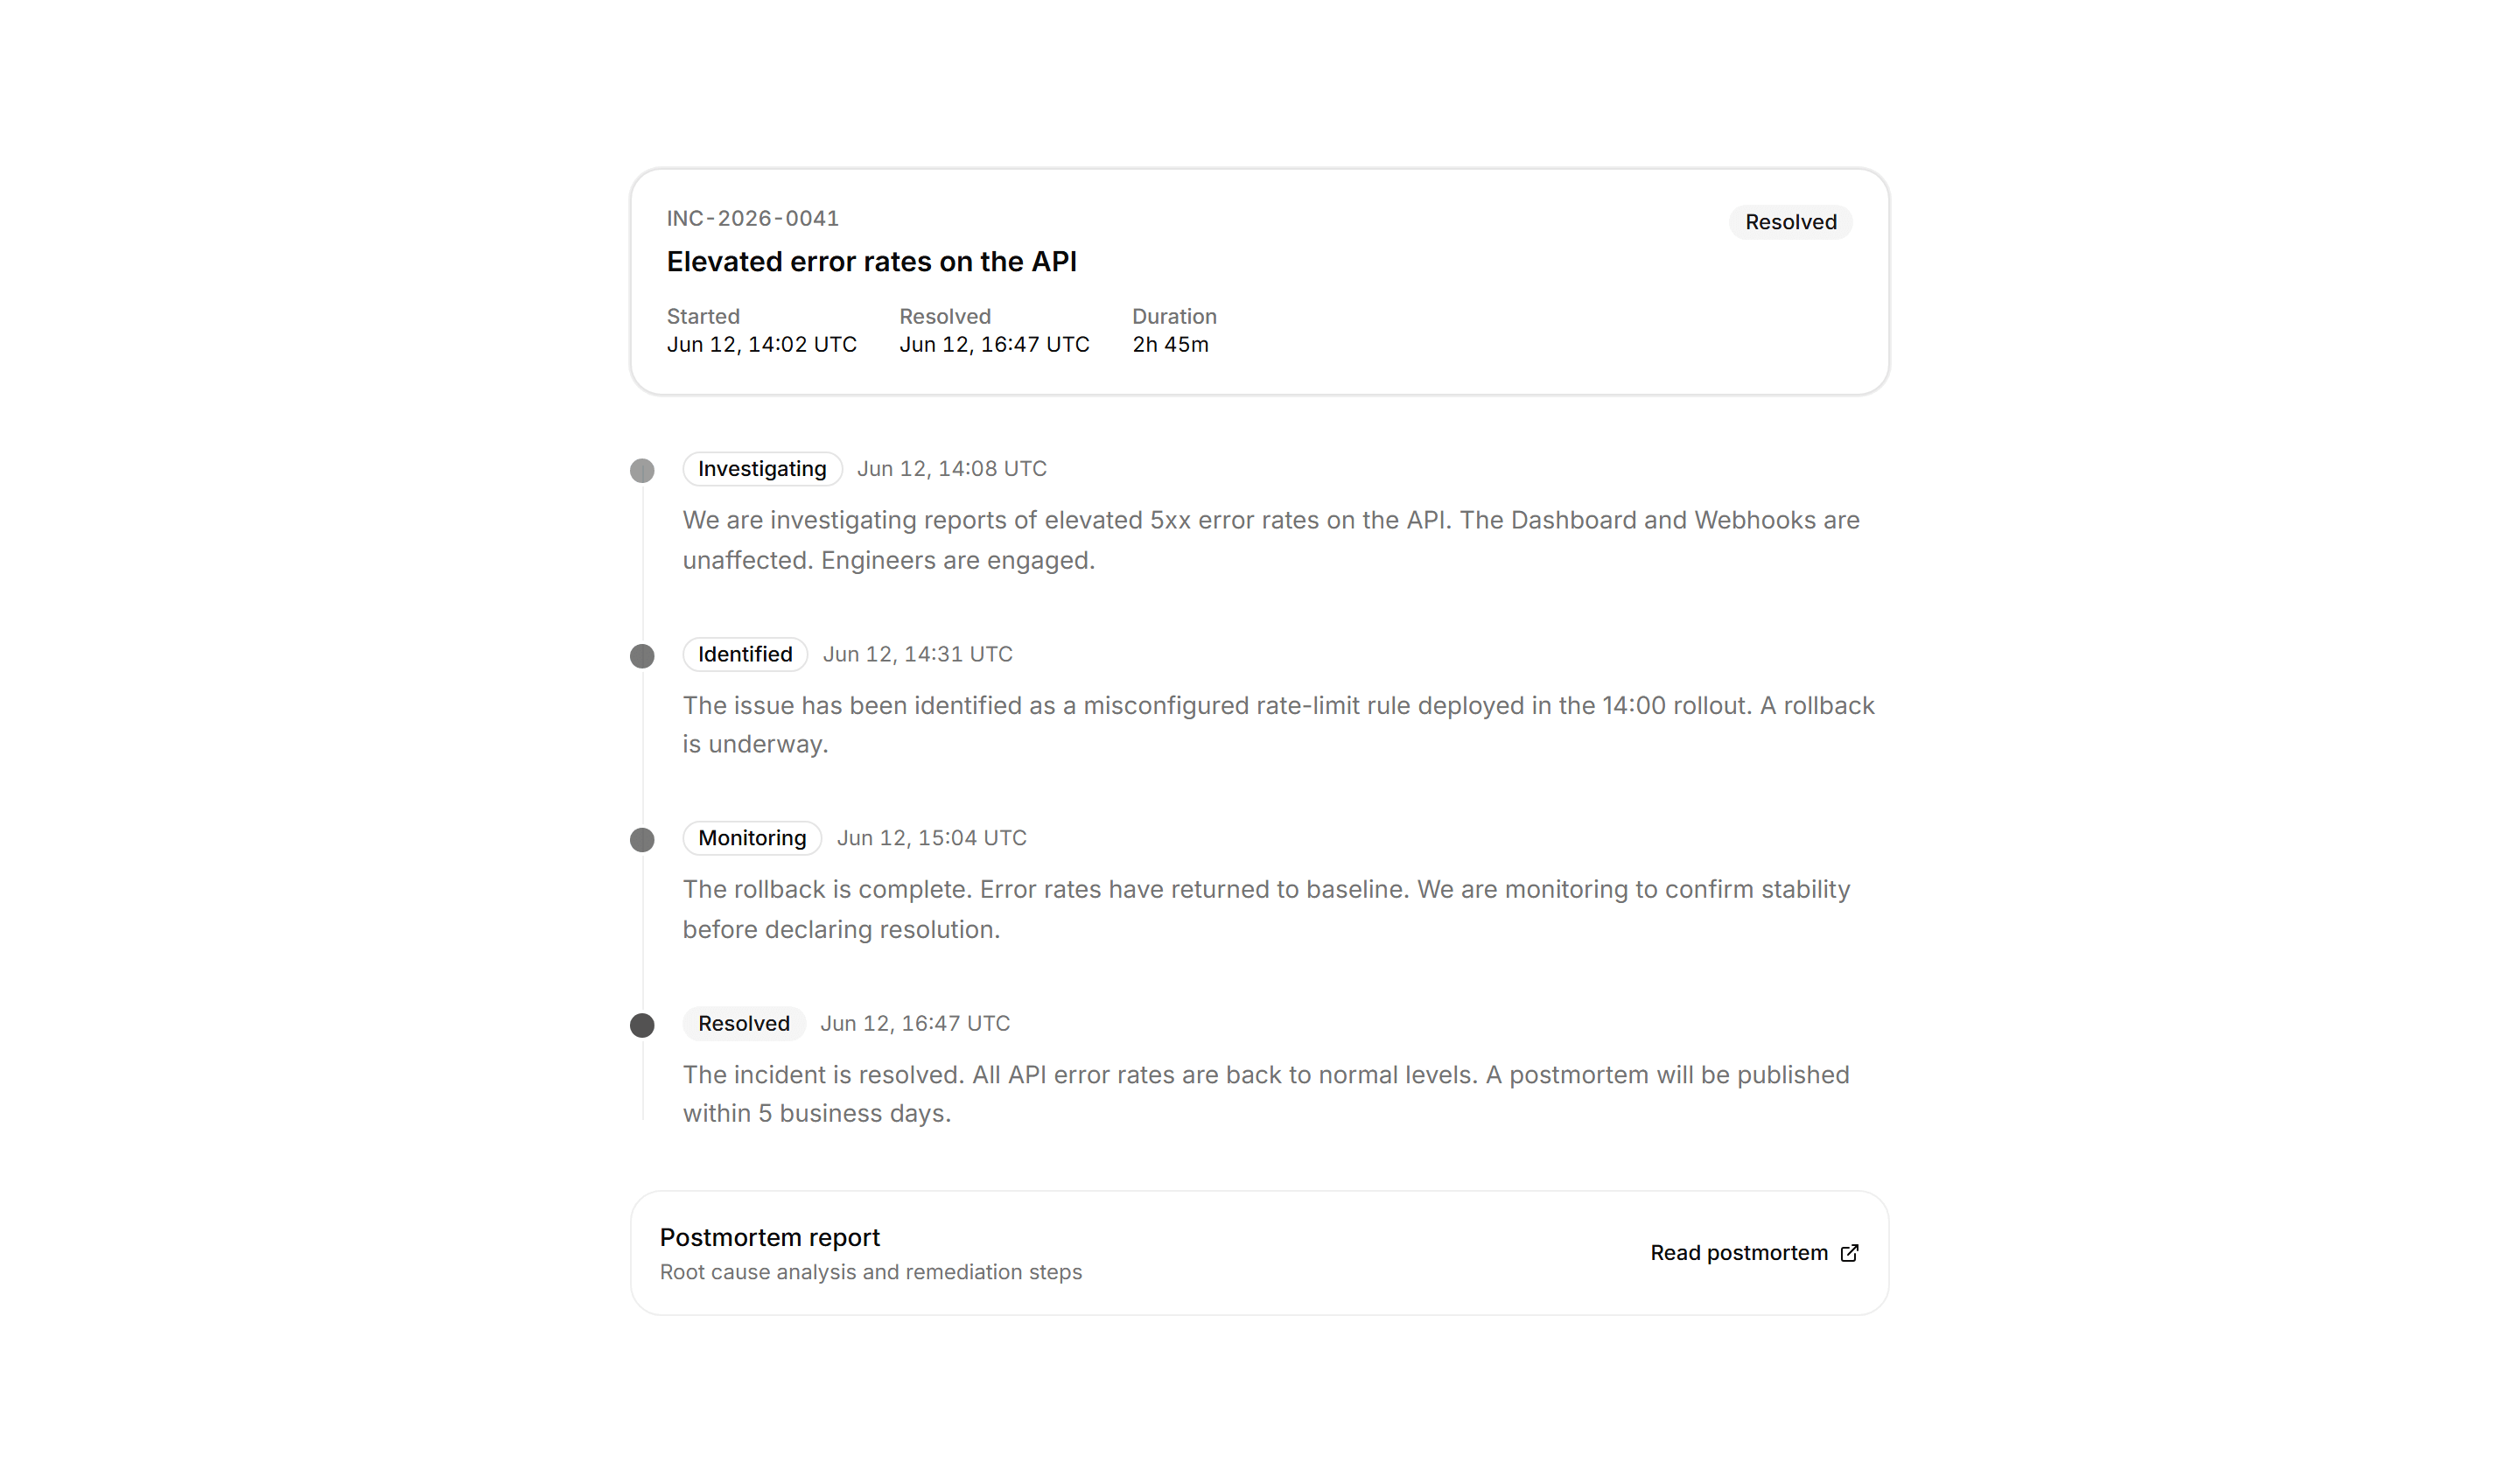
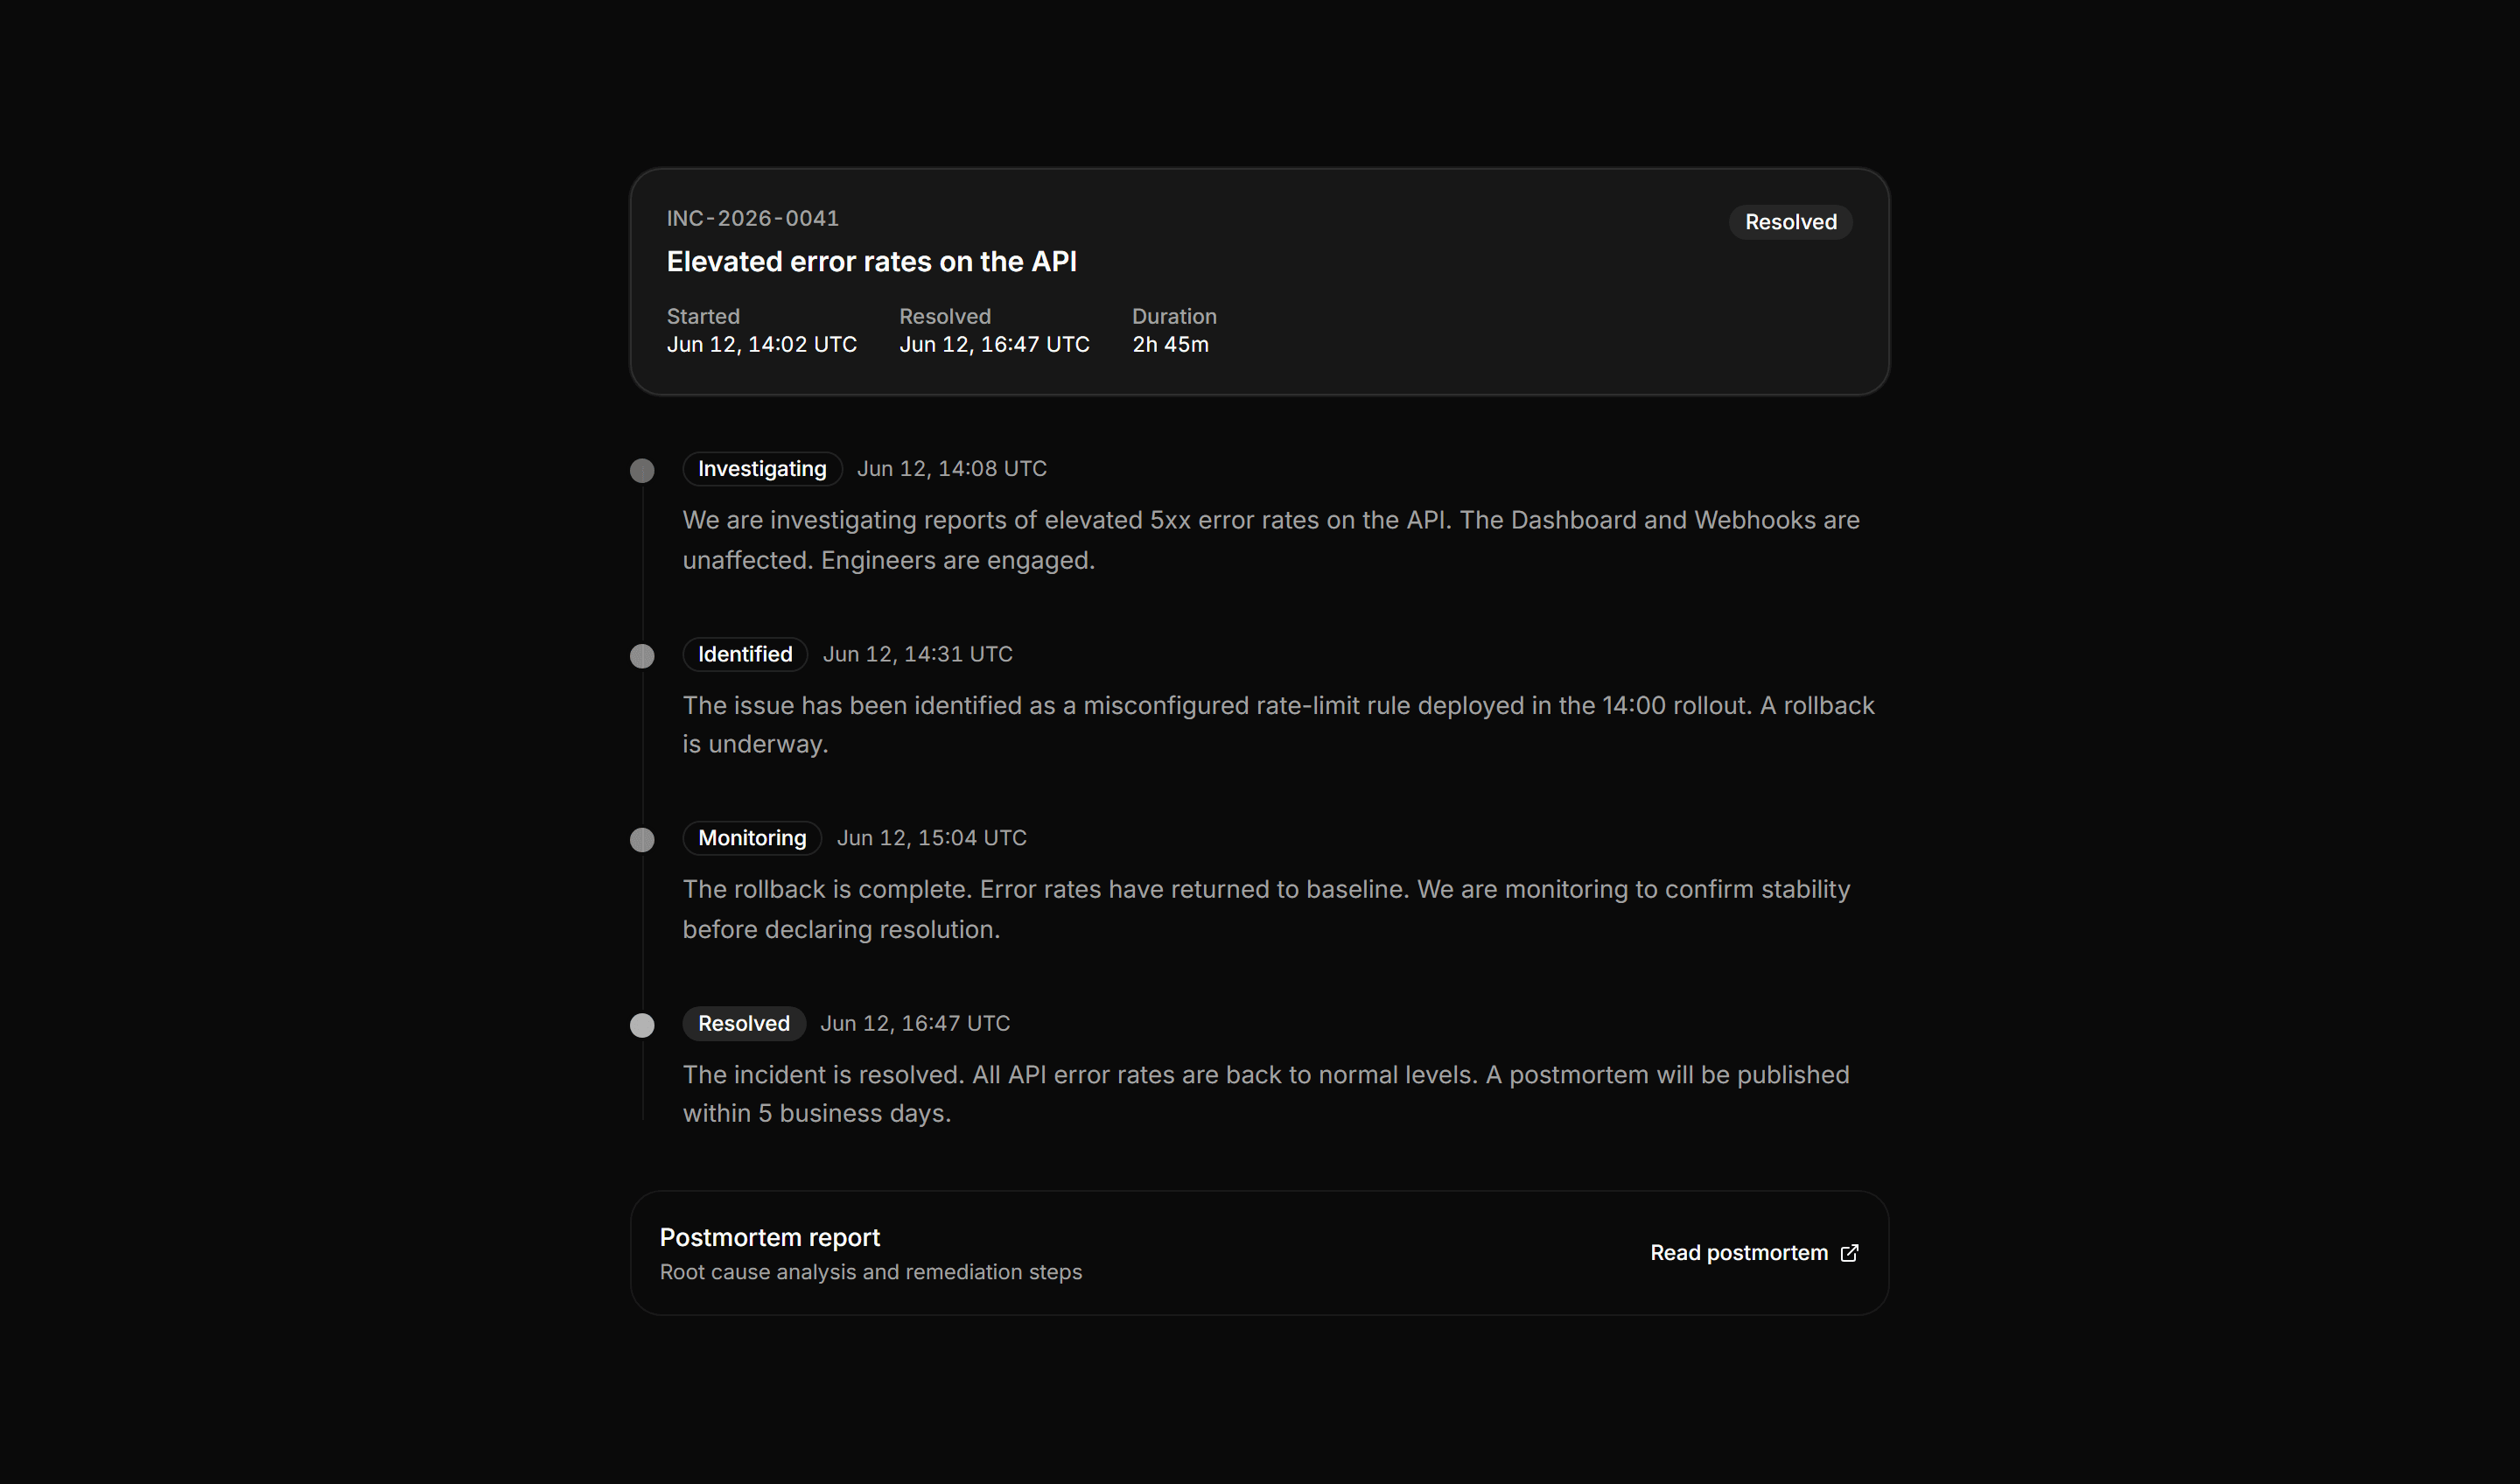
Application Status and Health: Incident Timeline
Incident detail card with a resolved header, a four-phase chronological update rail, and a postmortem link at the foot.
Application Status and Health: Component Status List
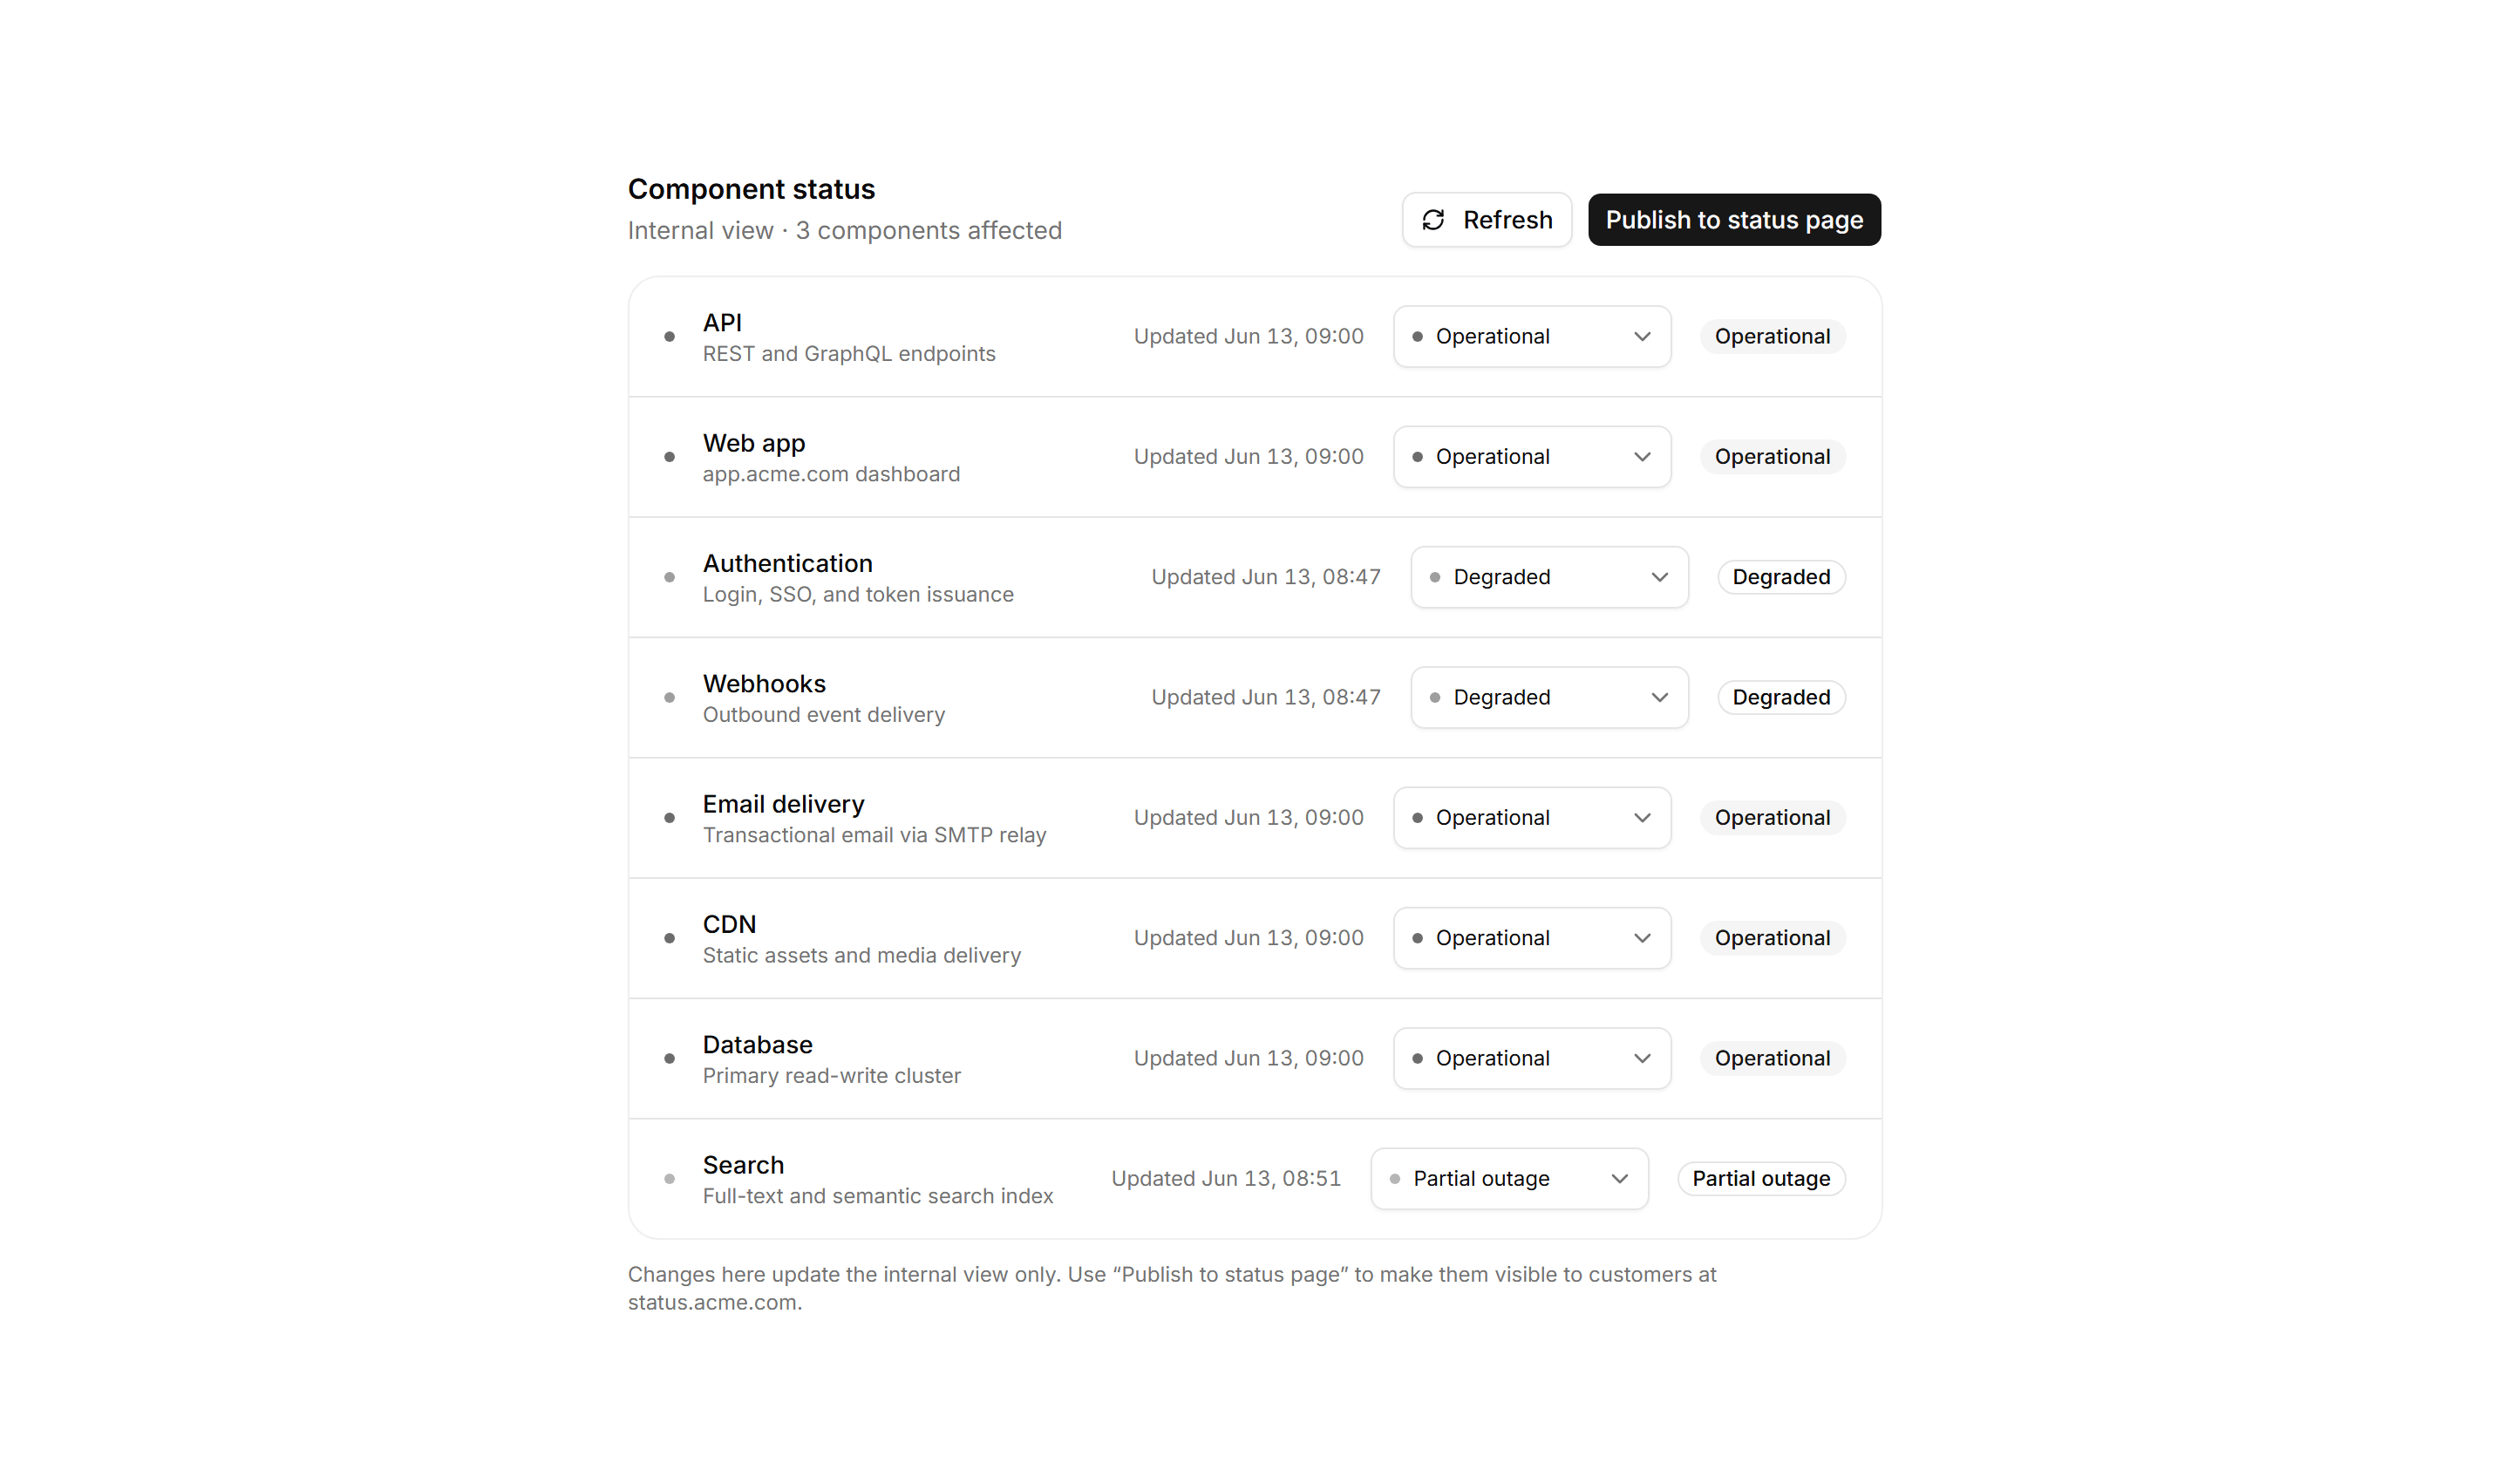
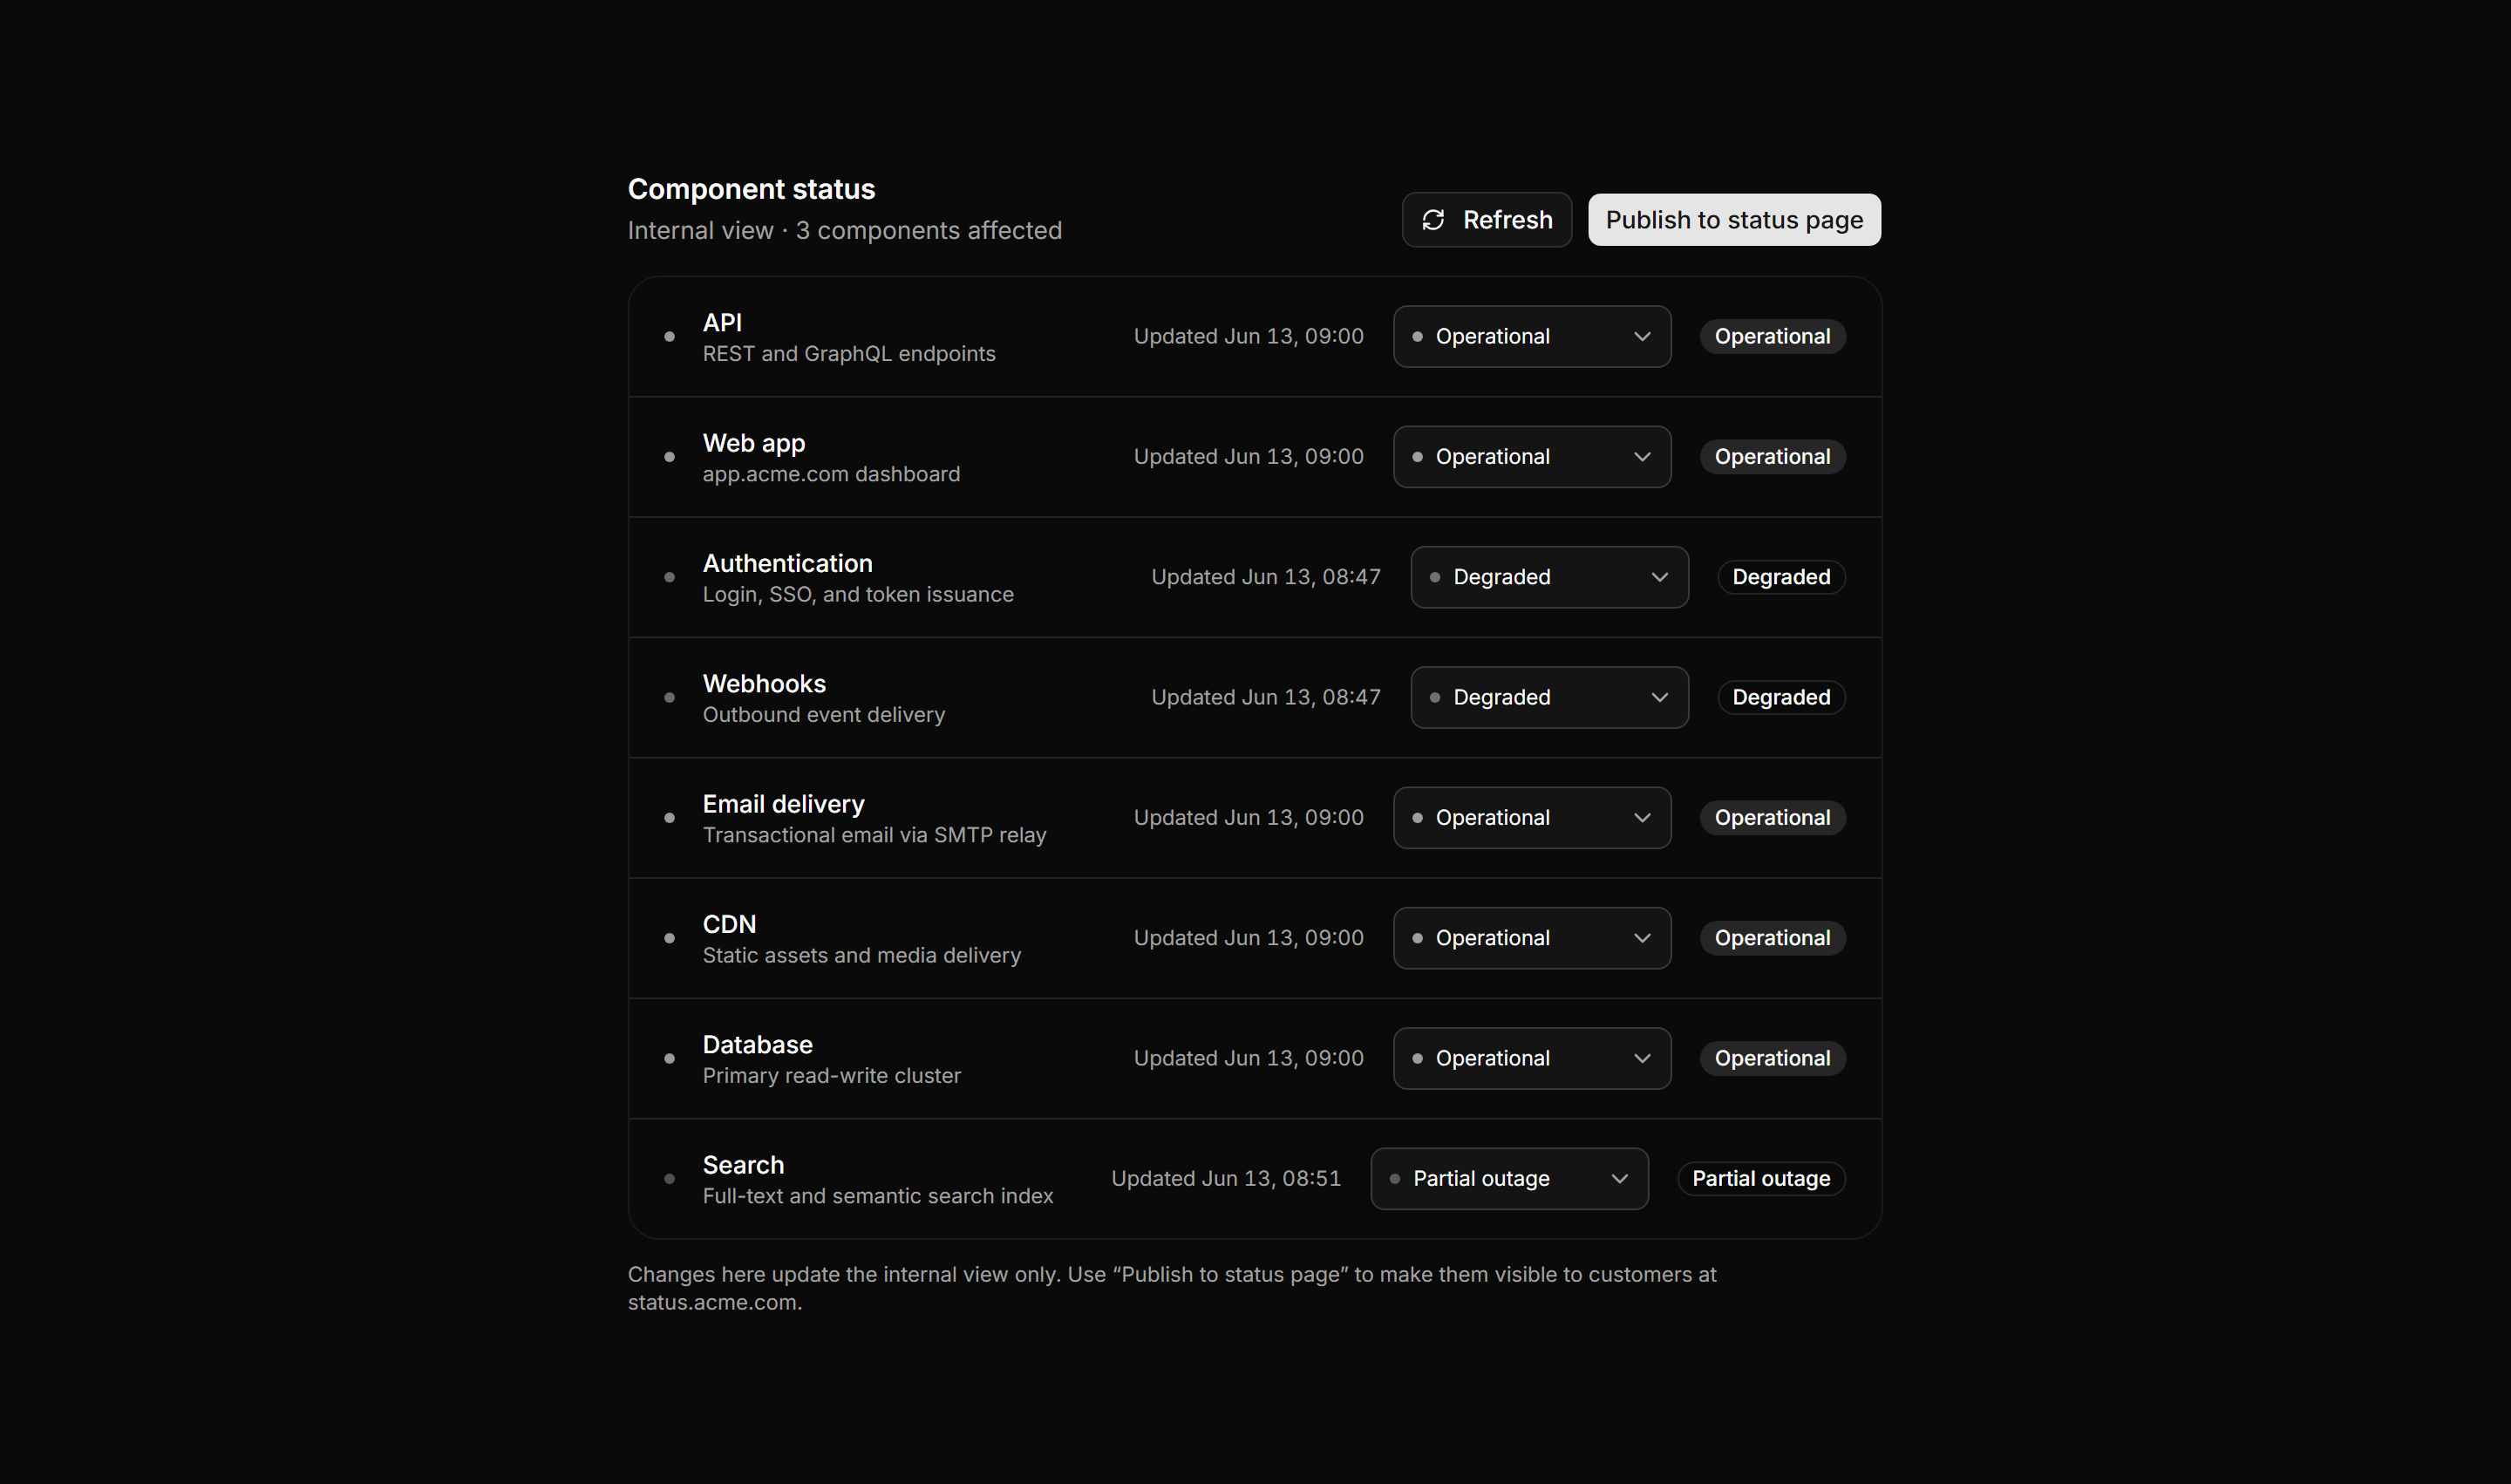
Editable internal status list with a per-row Select for Operational, Degraded, Partial outage, or Down and a publish to status page action.