Shadcn Stat Blocks
Browse 20 stats section blocks for shadcn/ui. Counters, metric cards, progress bars, timelines, and comparison layouts that prove traction and build trust.
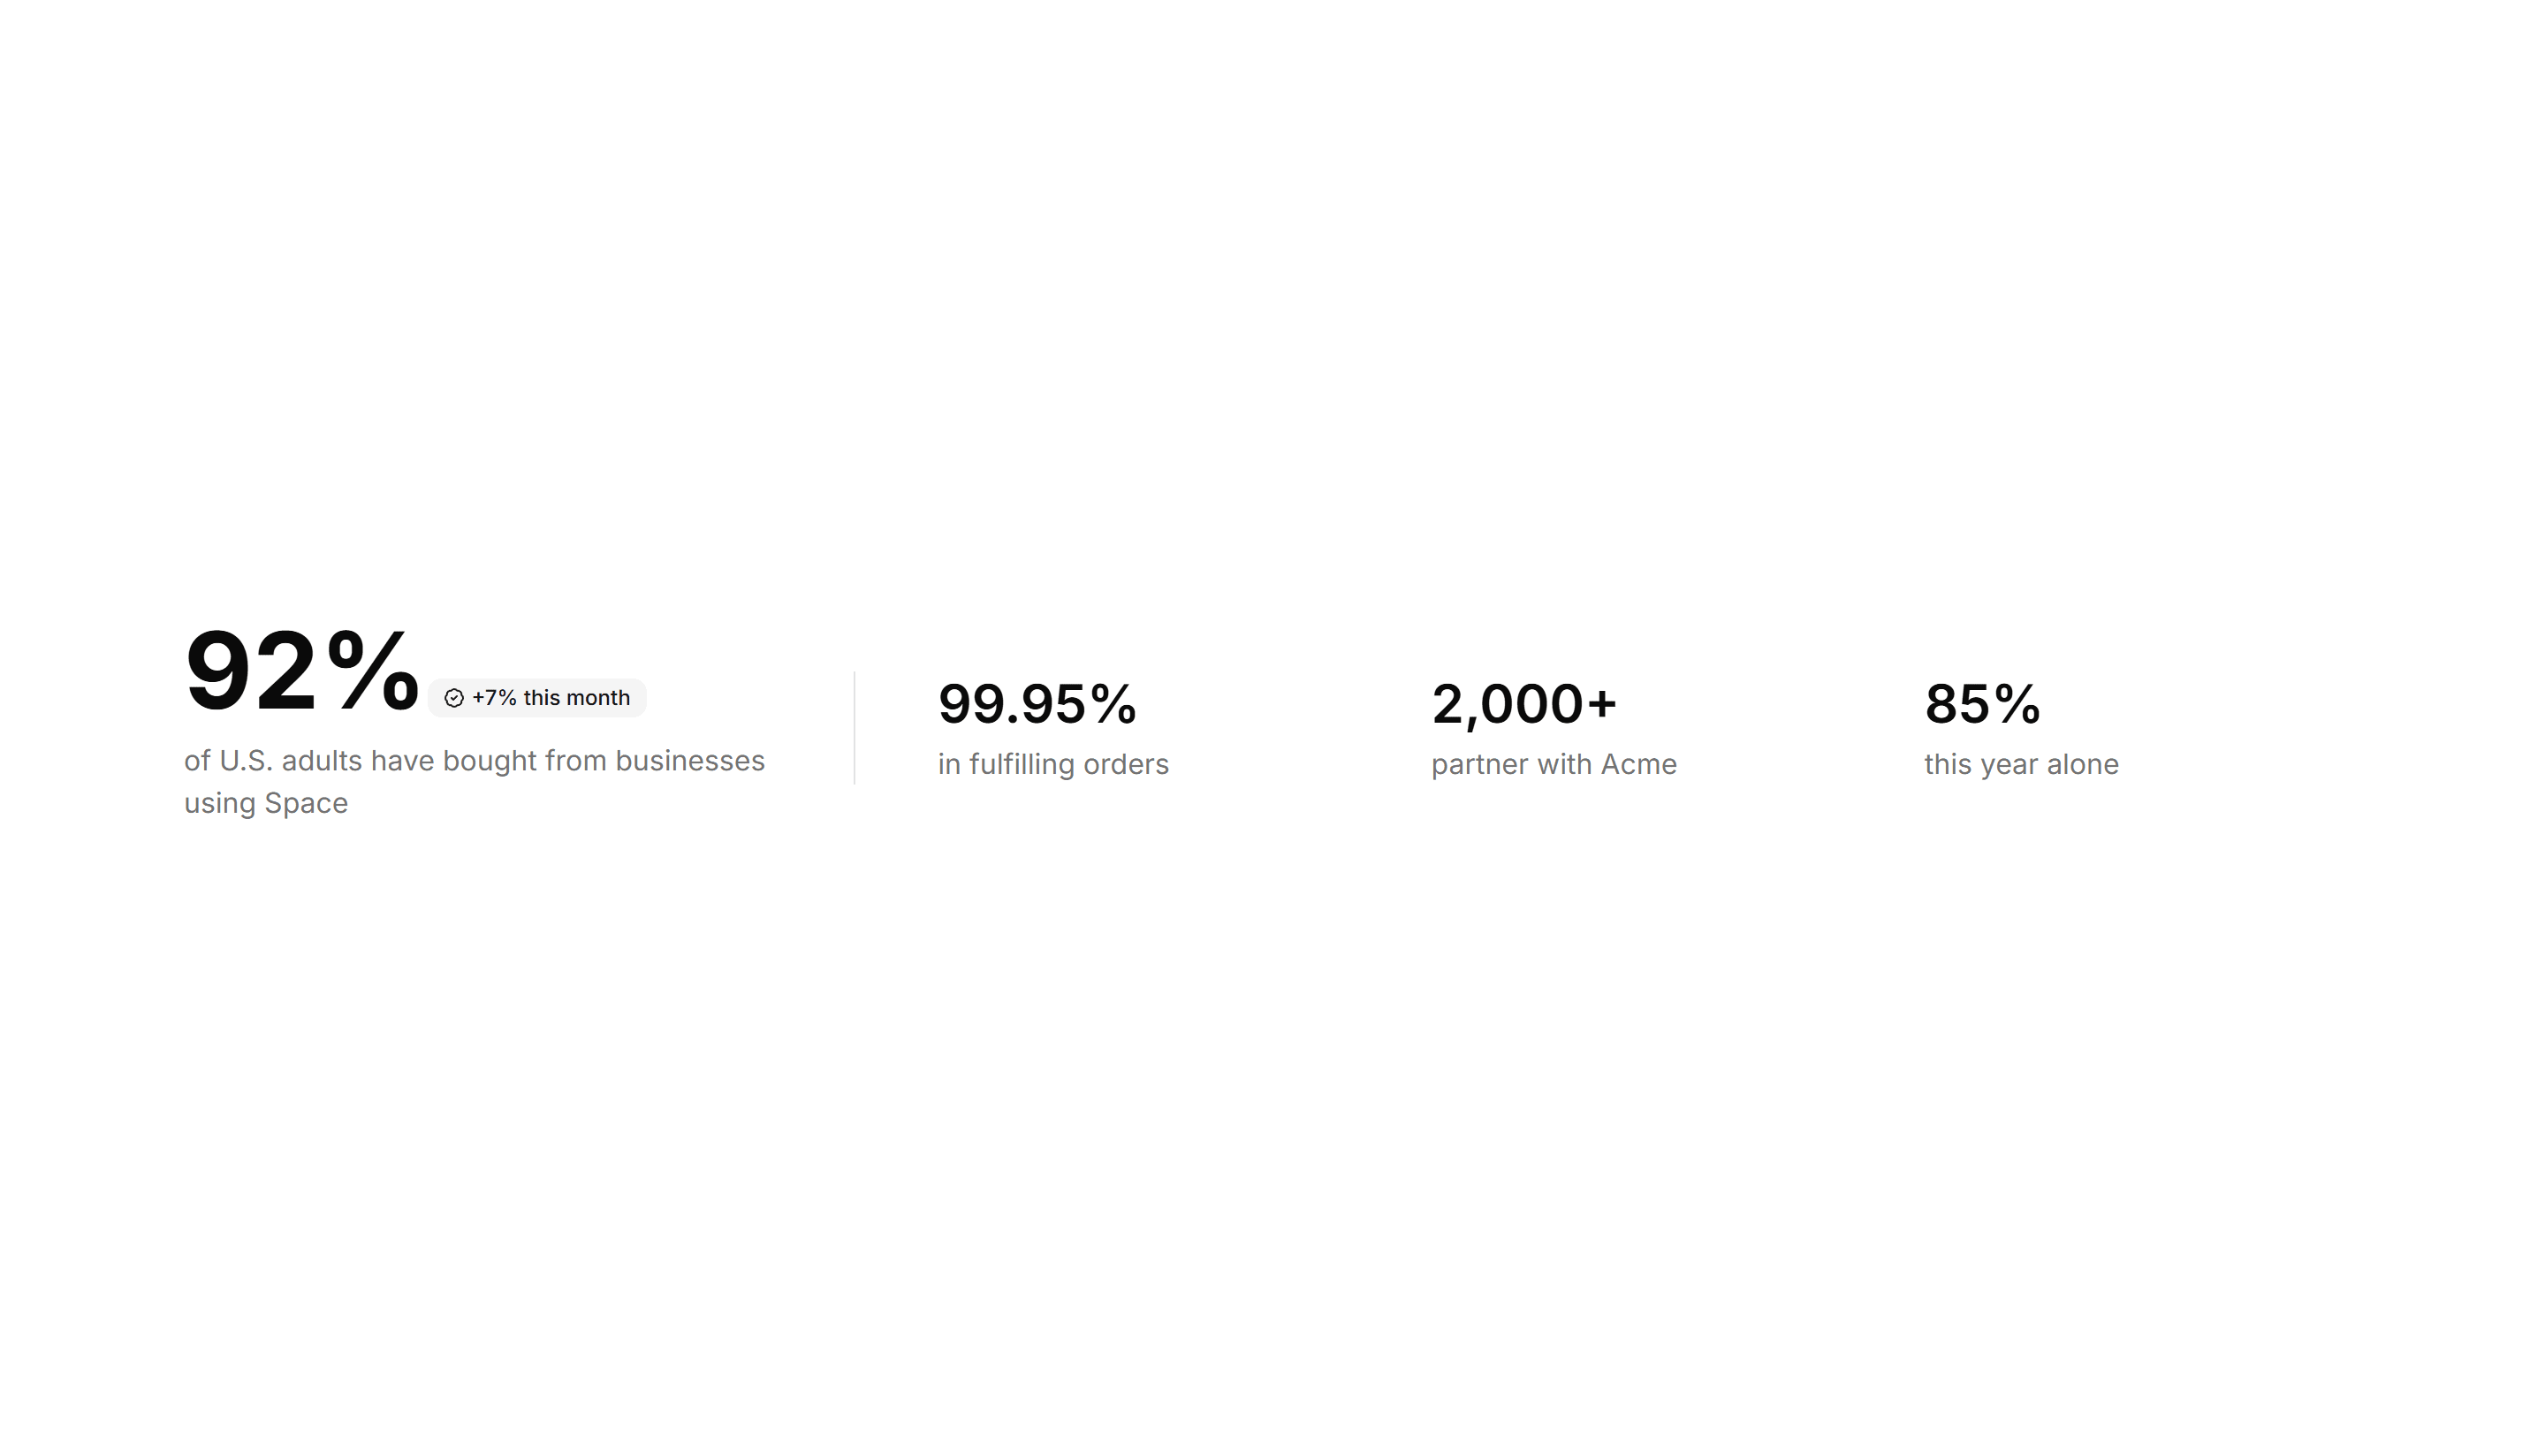
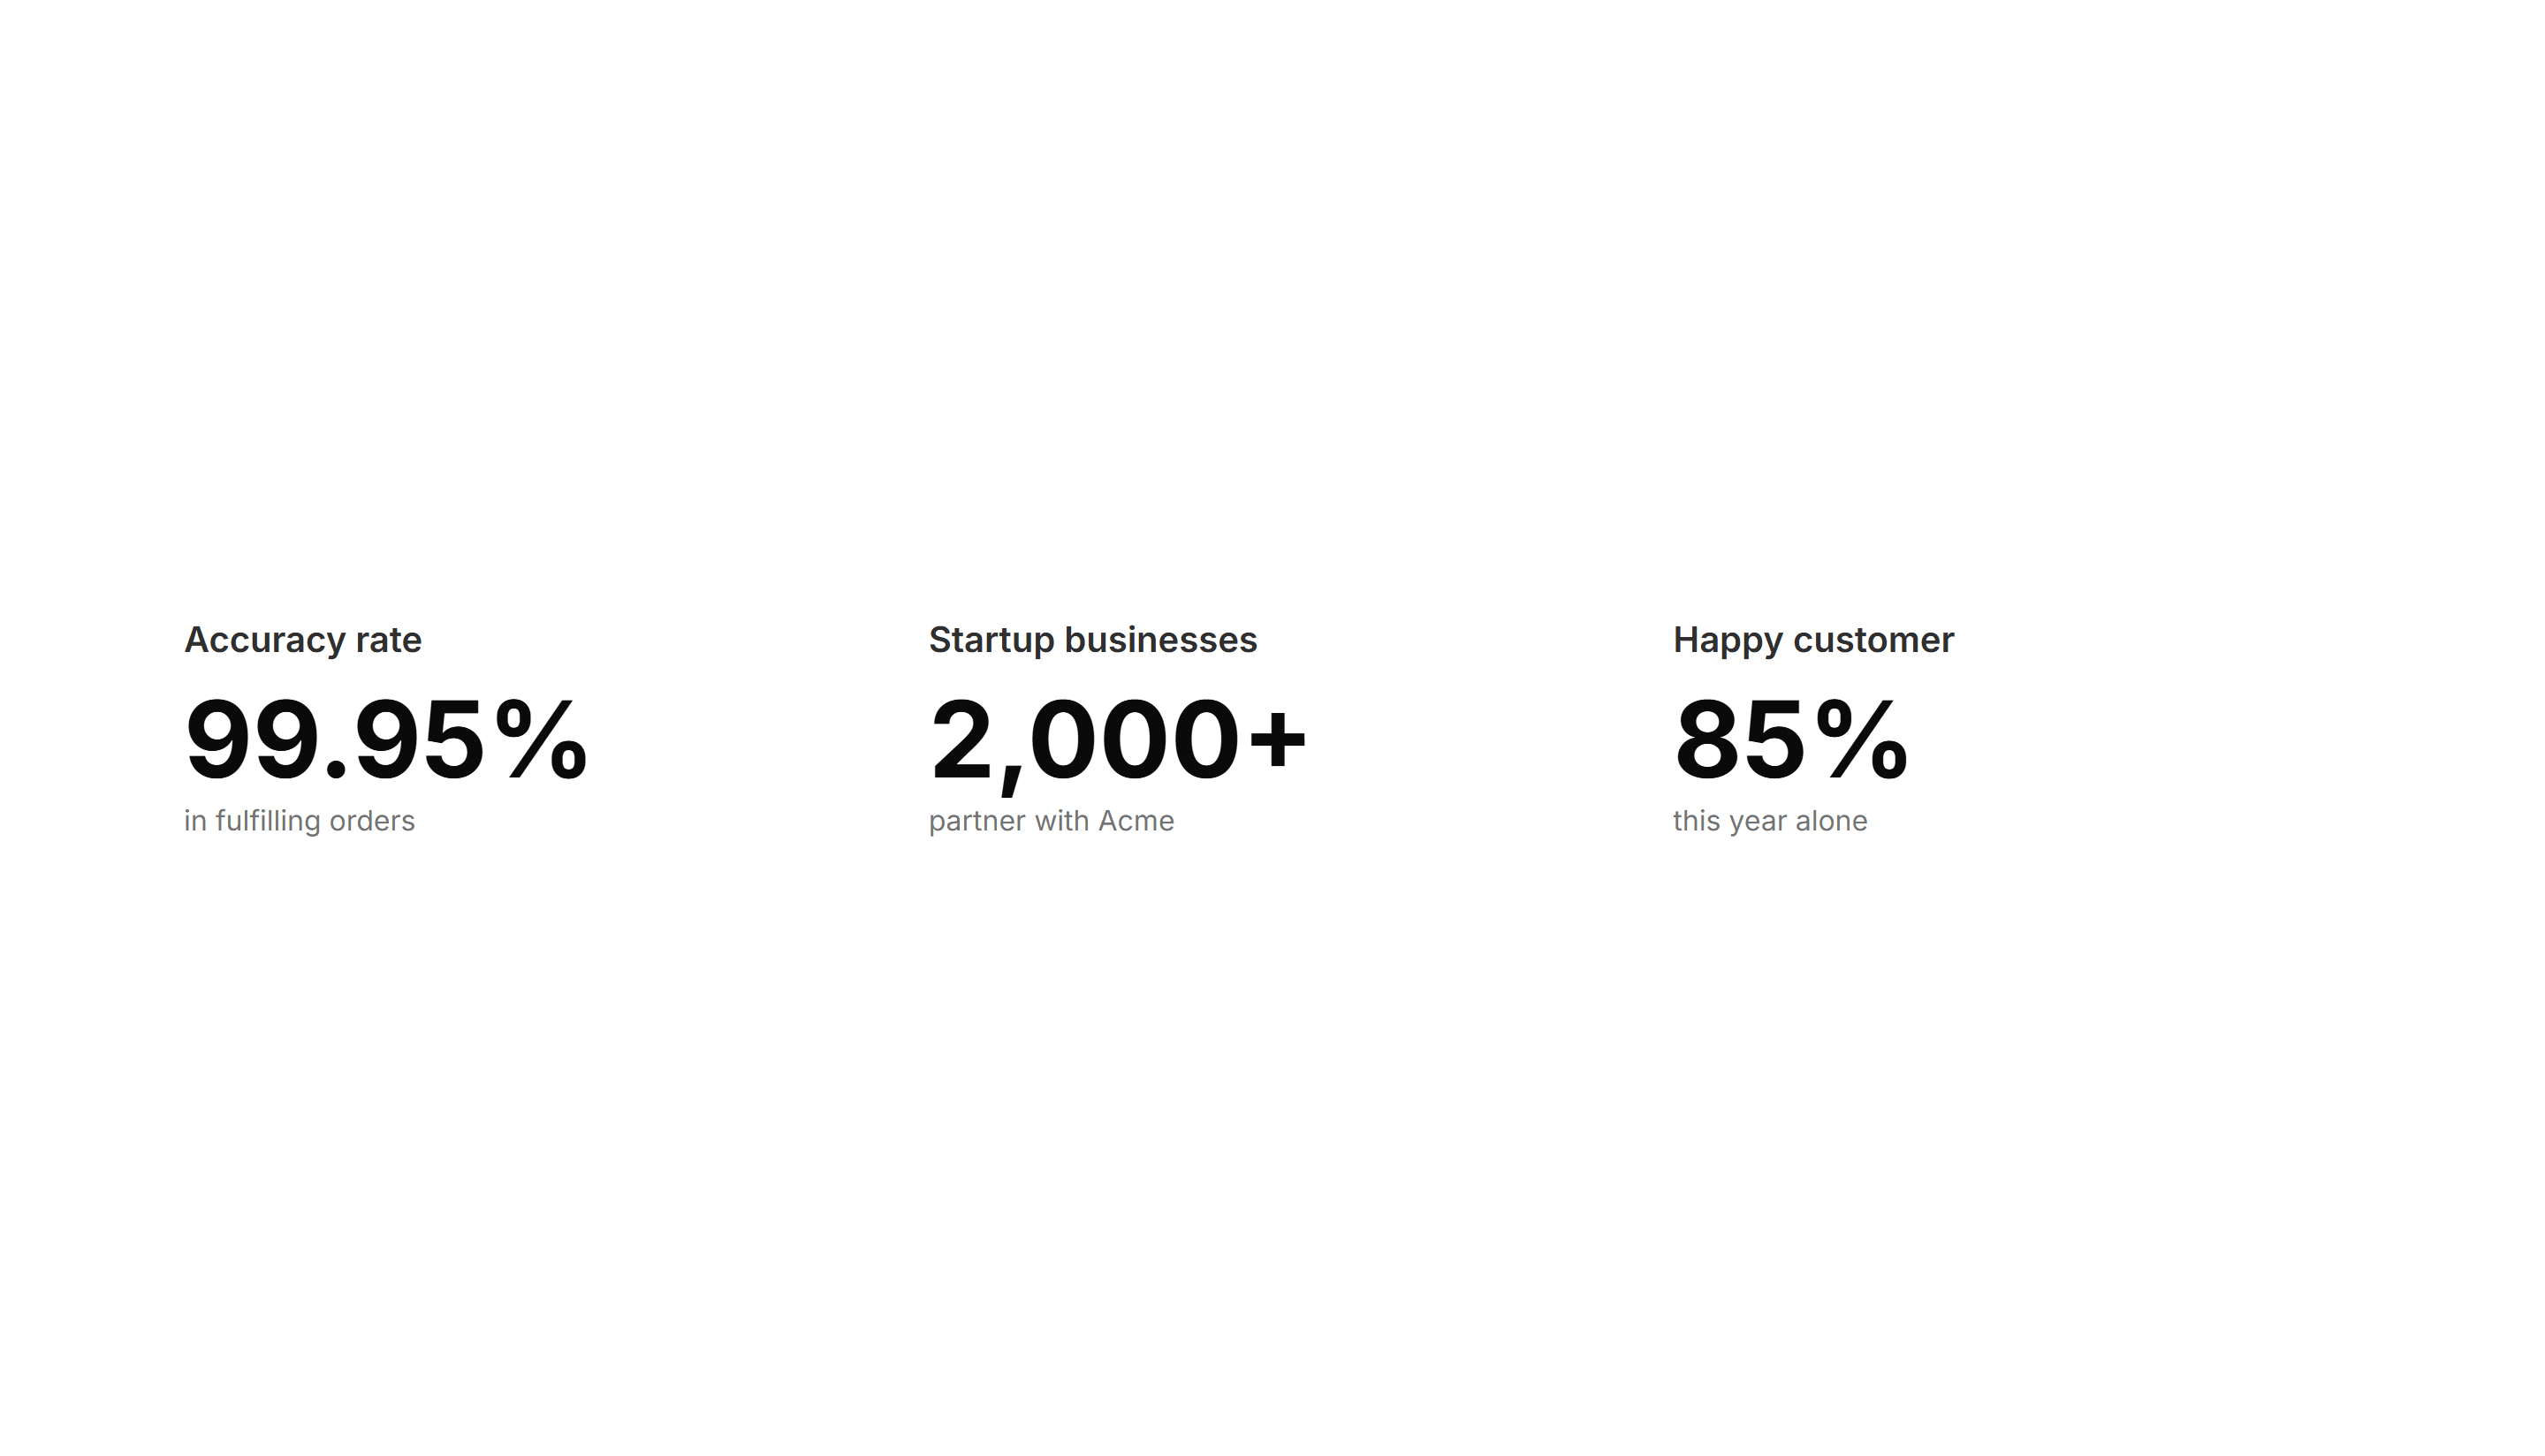
Marketing Stat: One Main With Three Follow Ups
One large headline number anchored by three smaller supporting stats. Use it to lead with your strongest figure and back it with related proof.
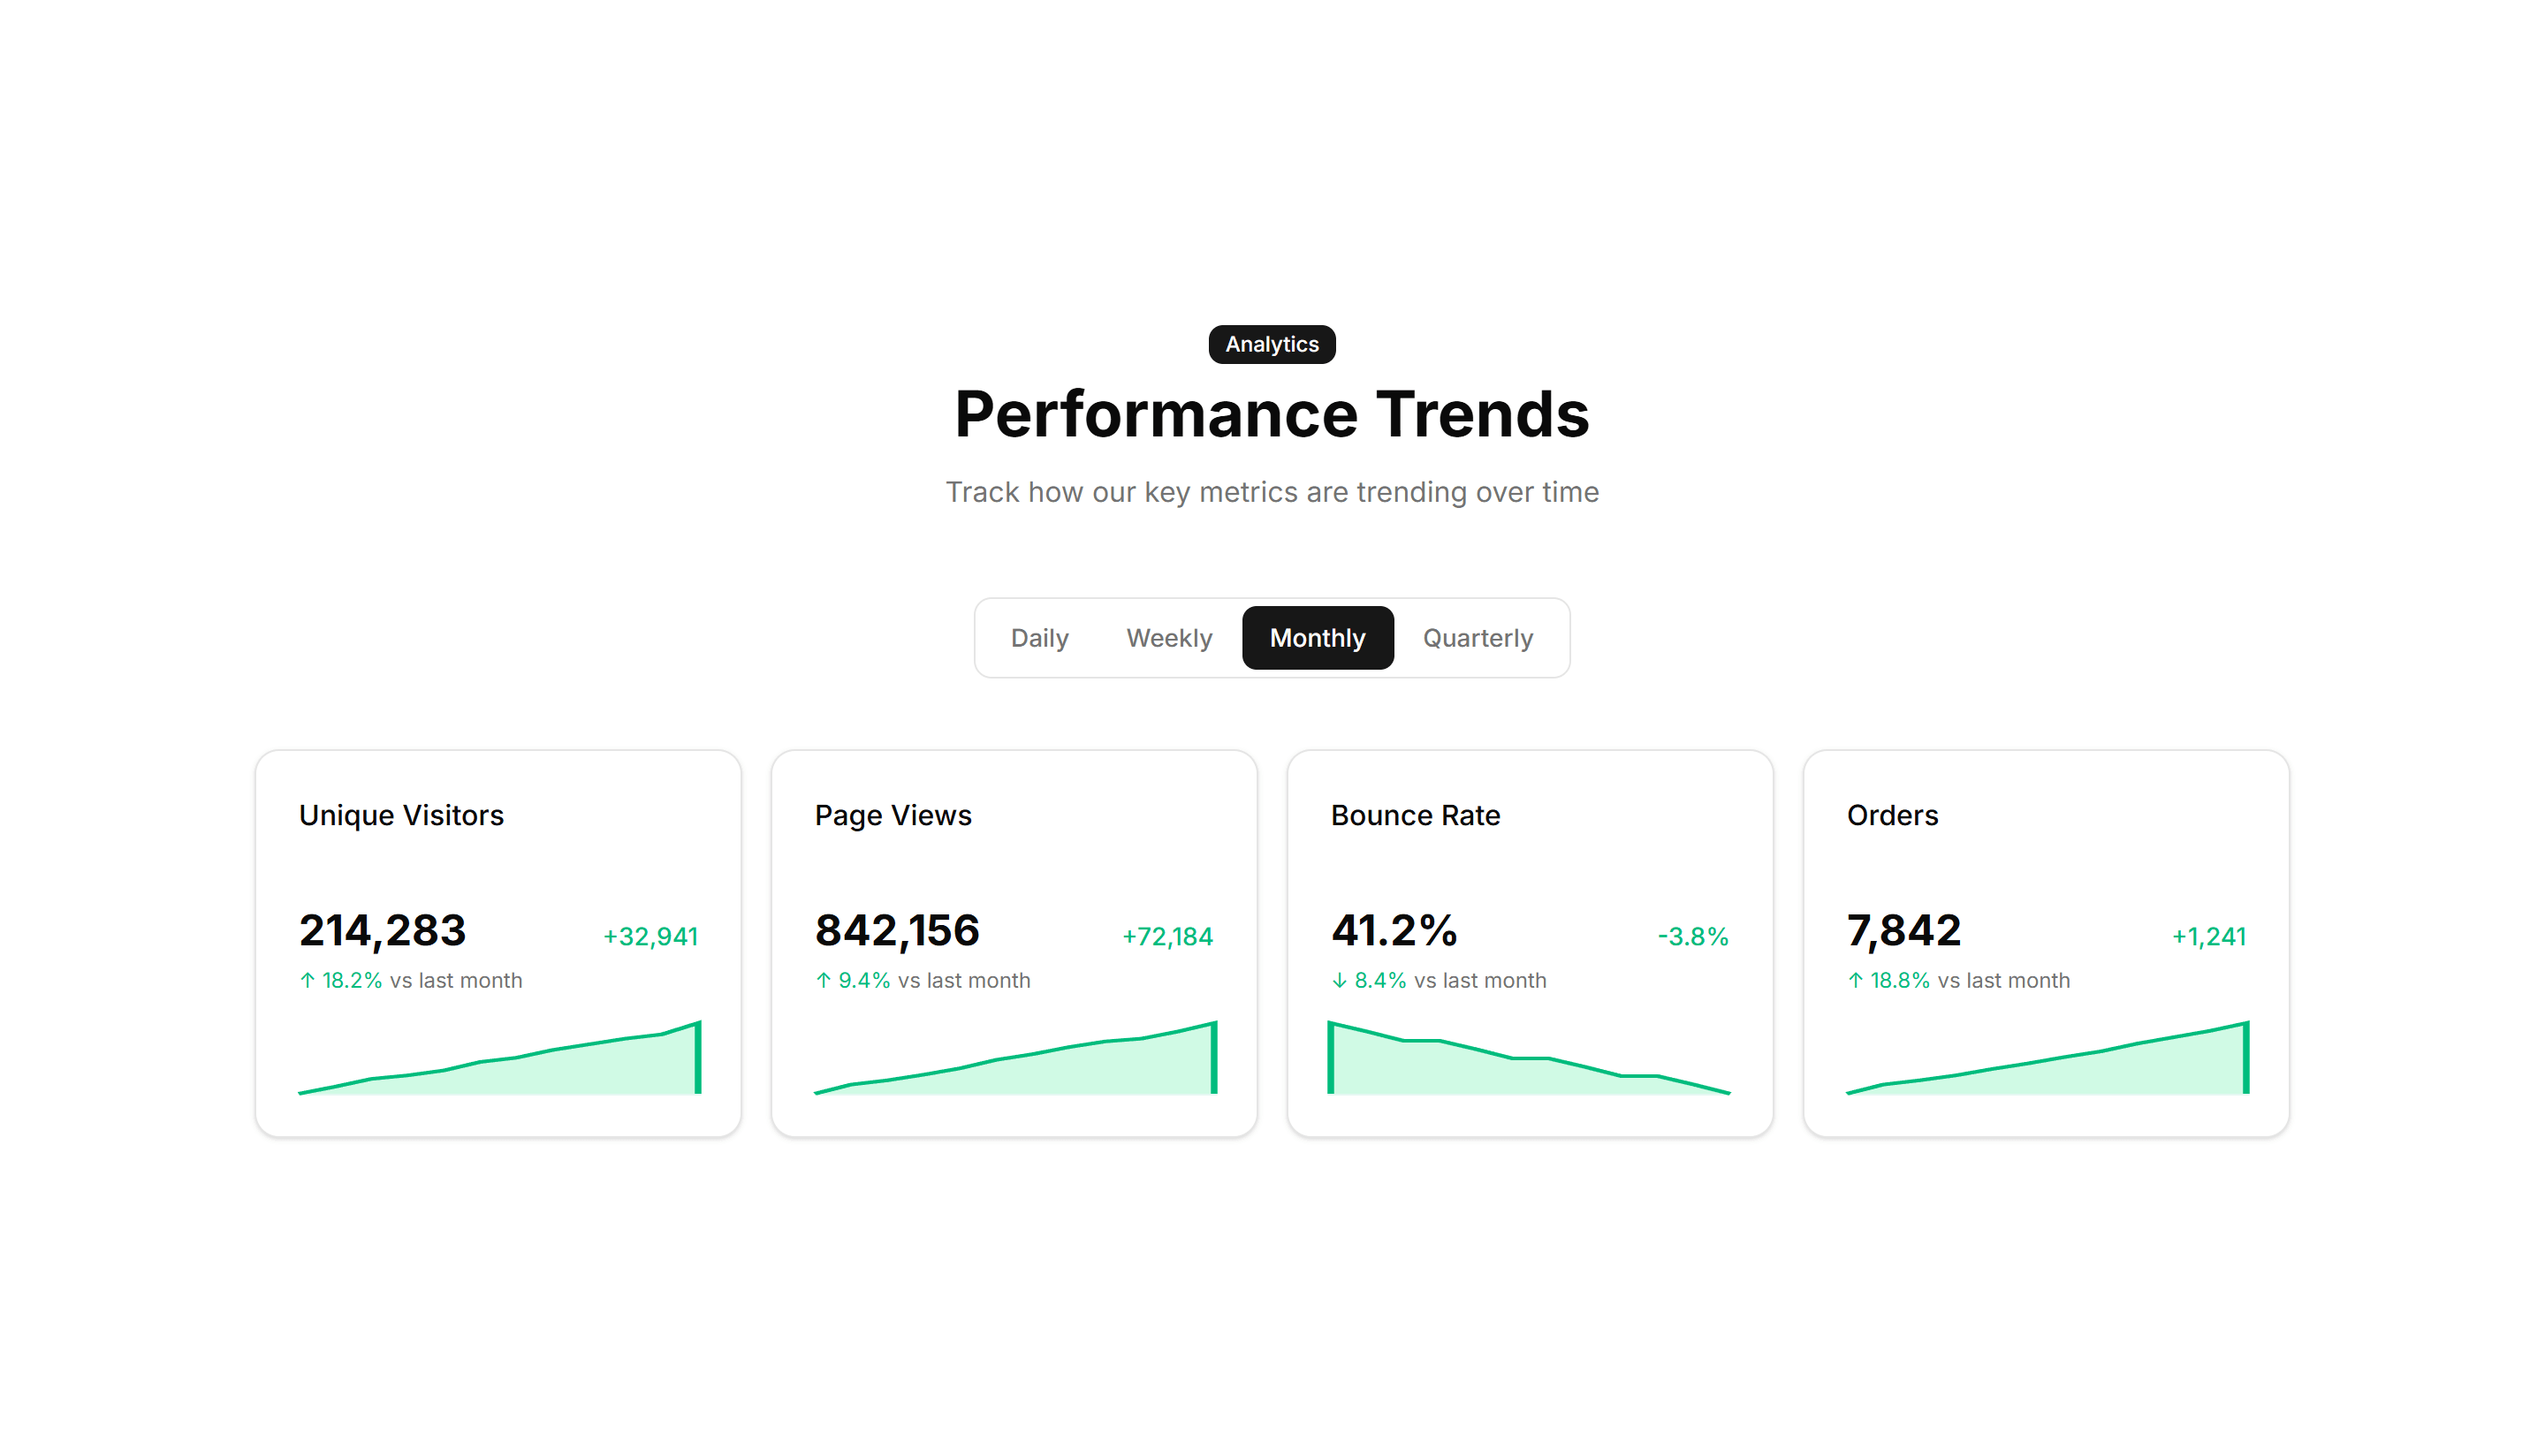
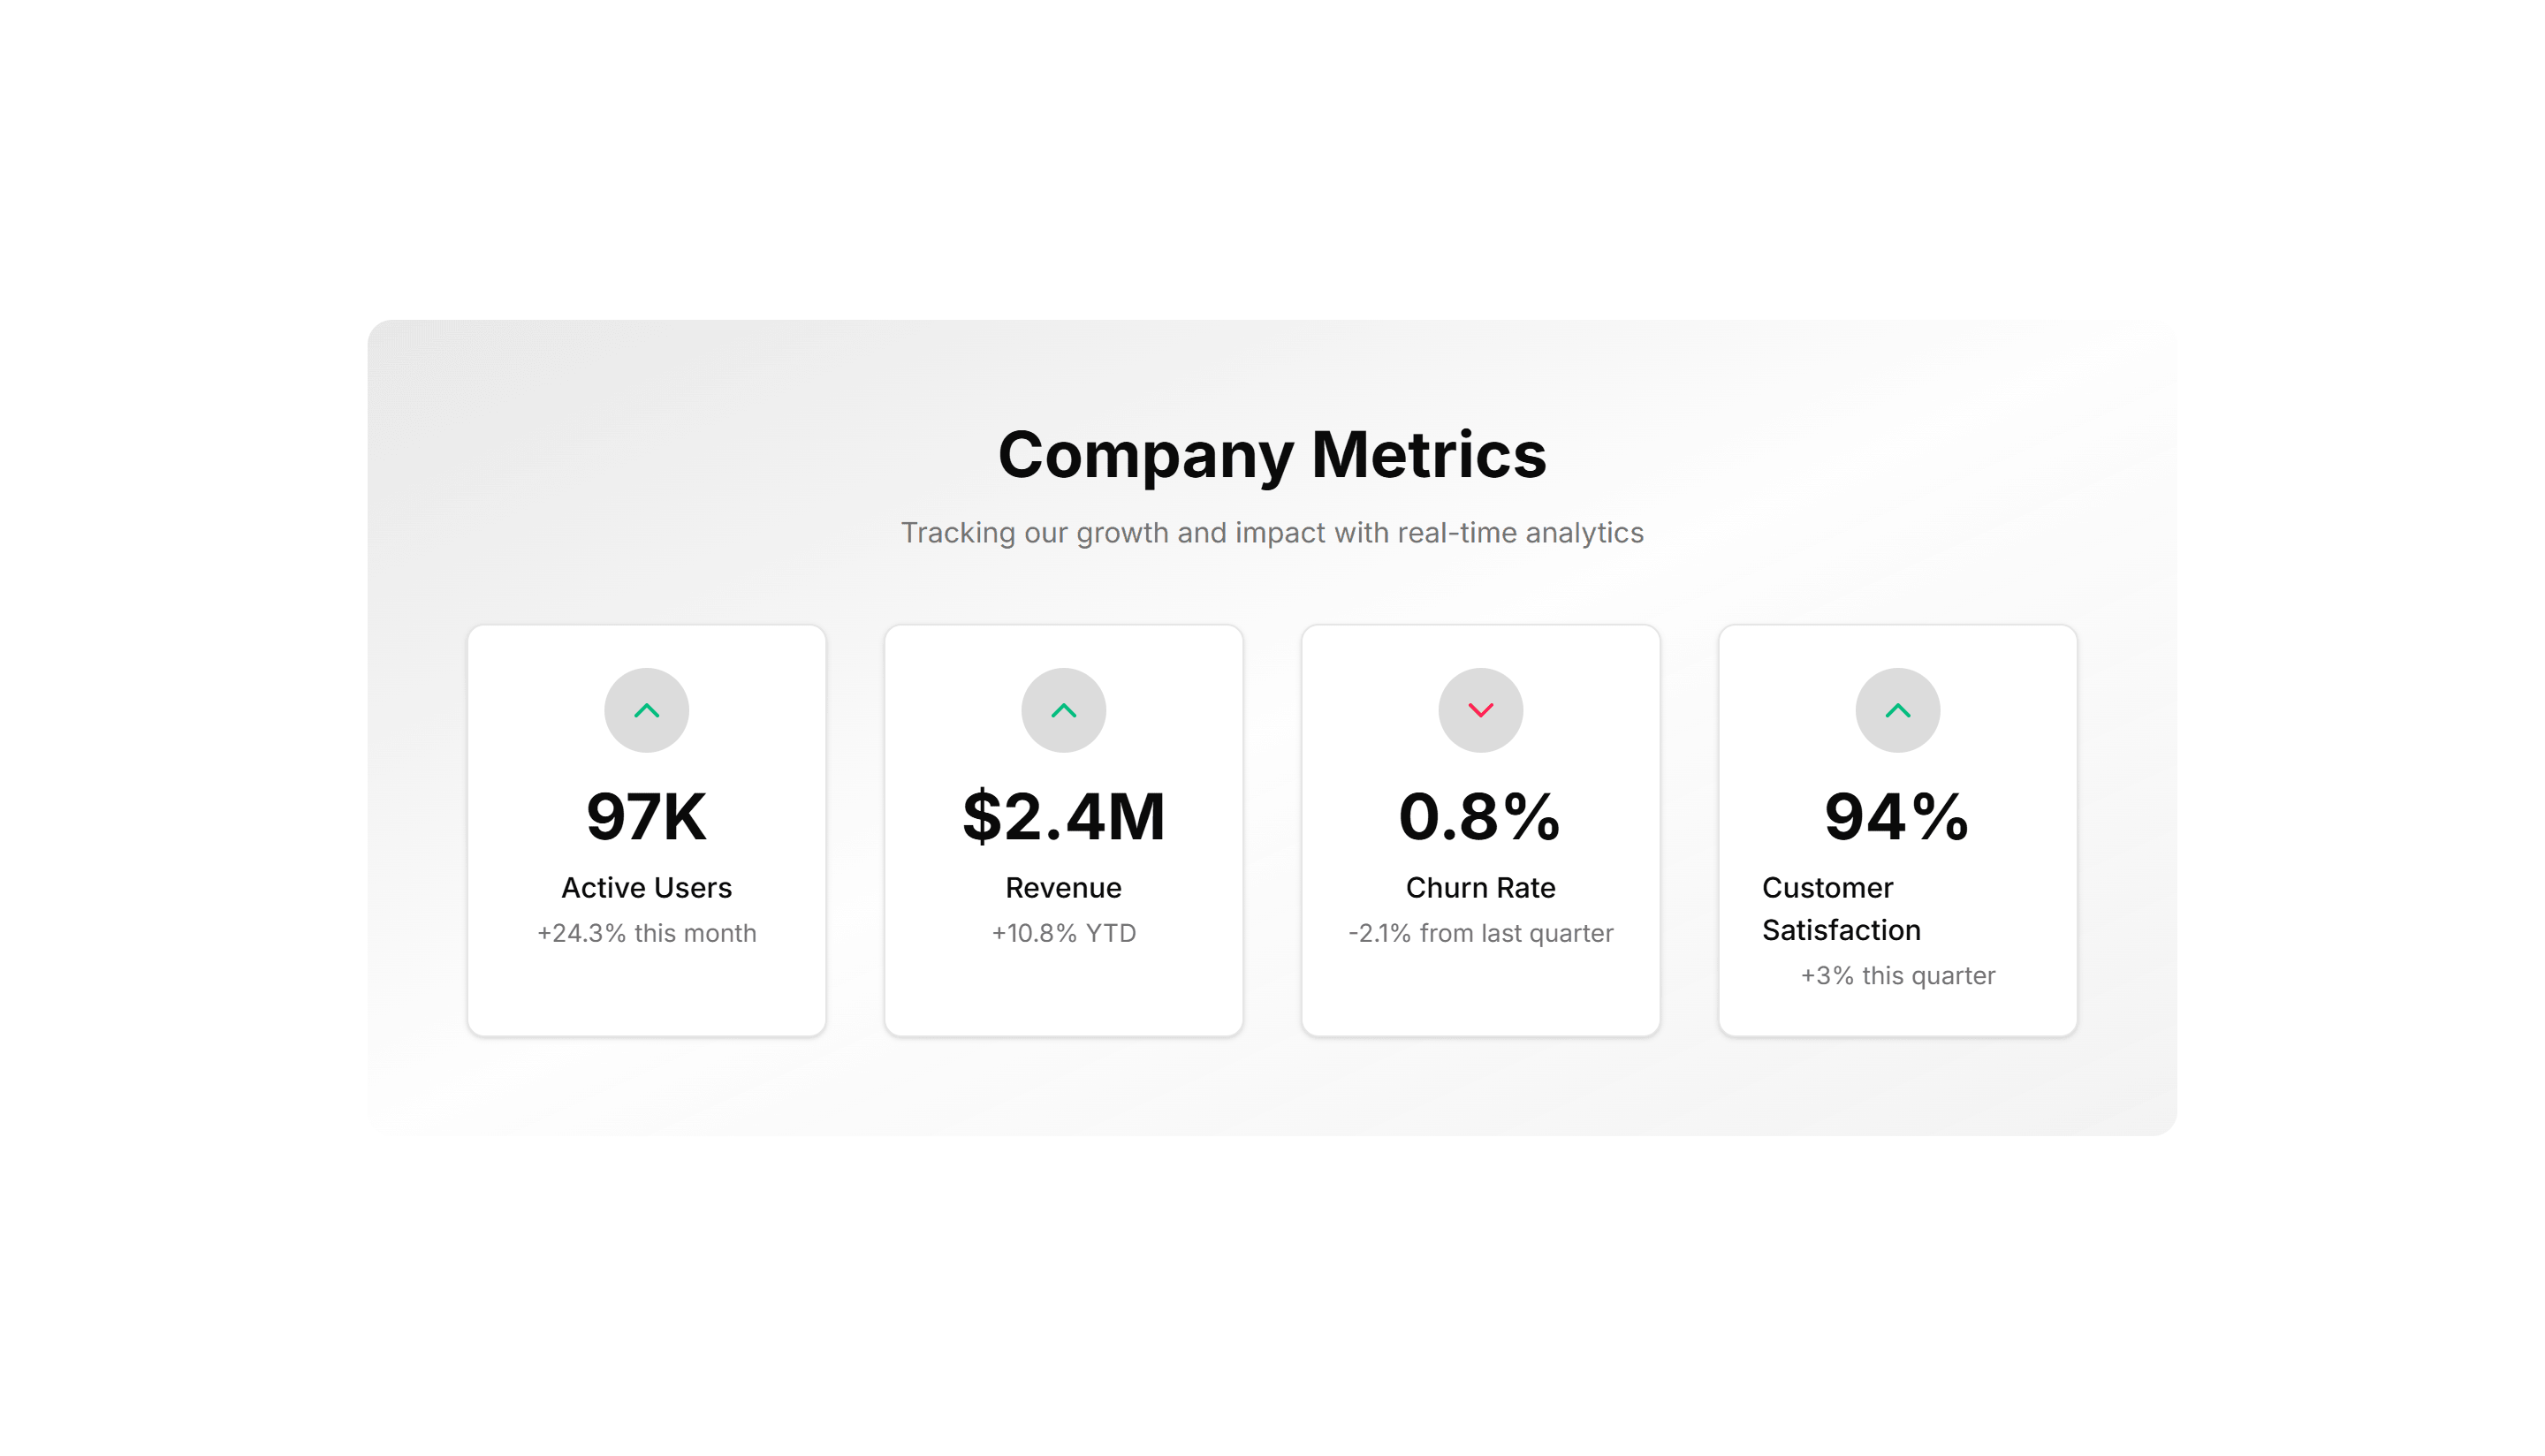
Marketing Stat: Sparkline Stats
Stat cards that pair a current value with a tiny inline trend chart. Use it to show a number and its recent direction together on a dashboard view.
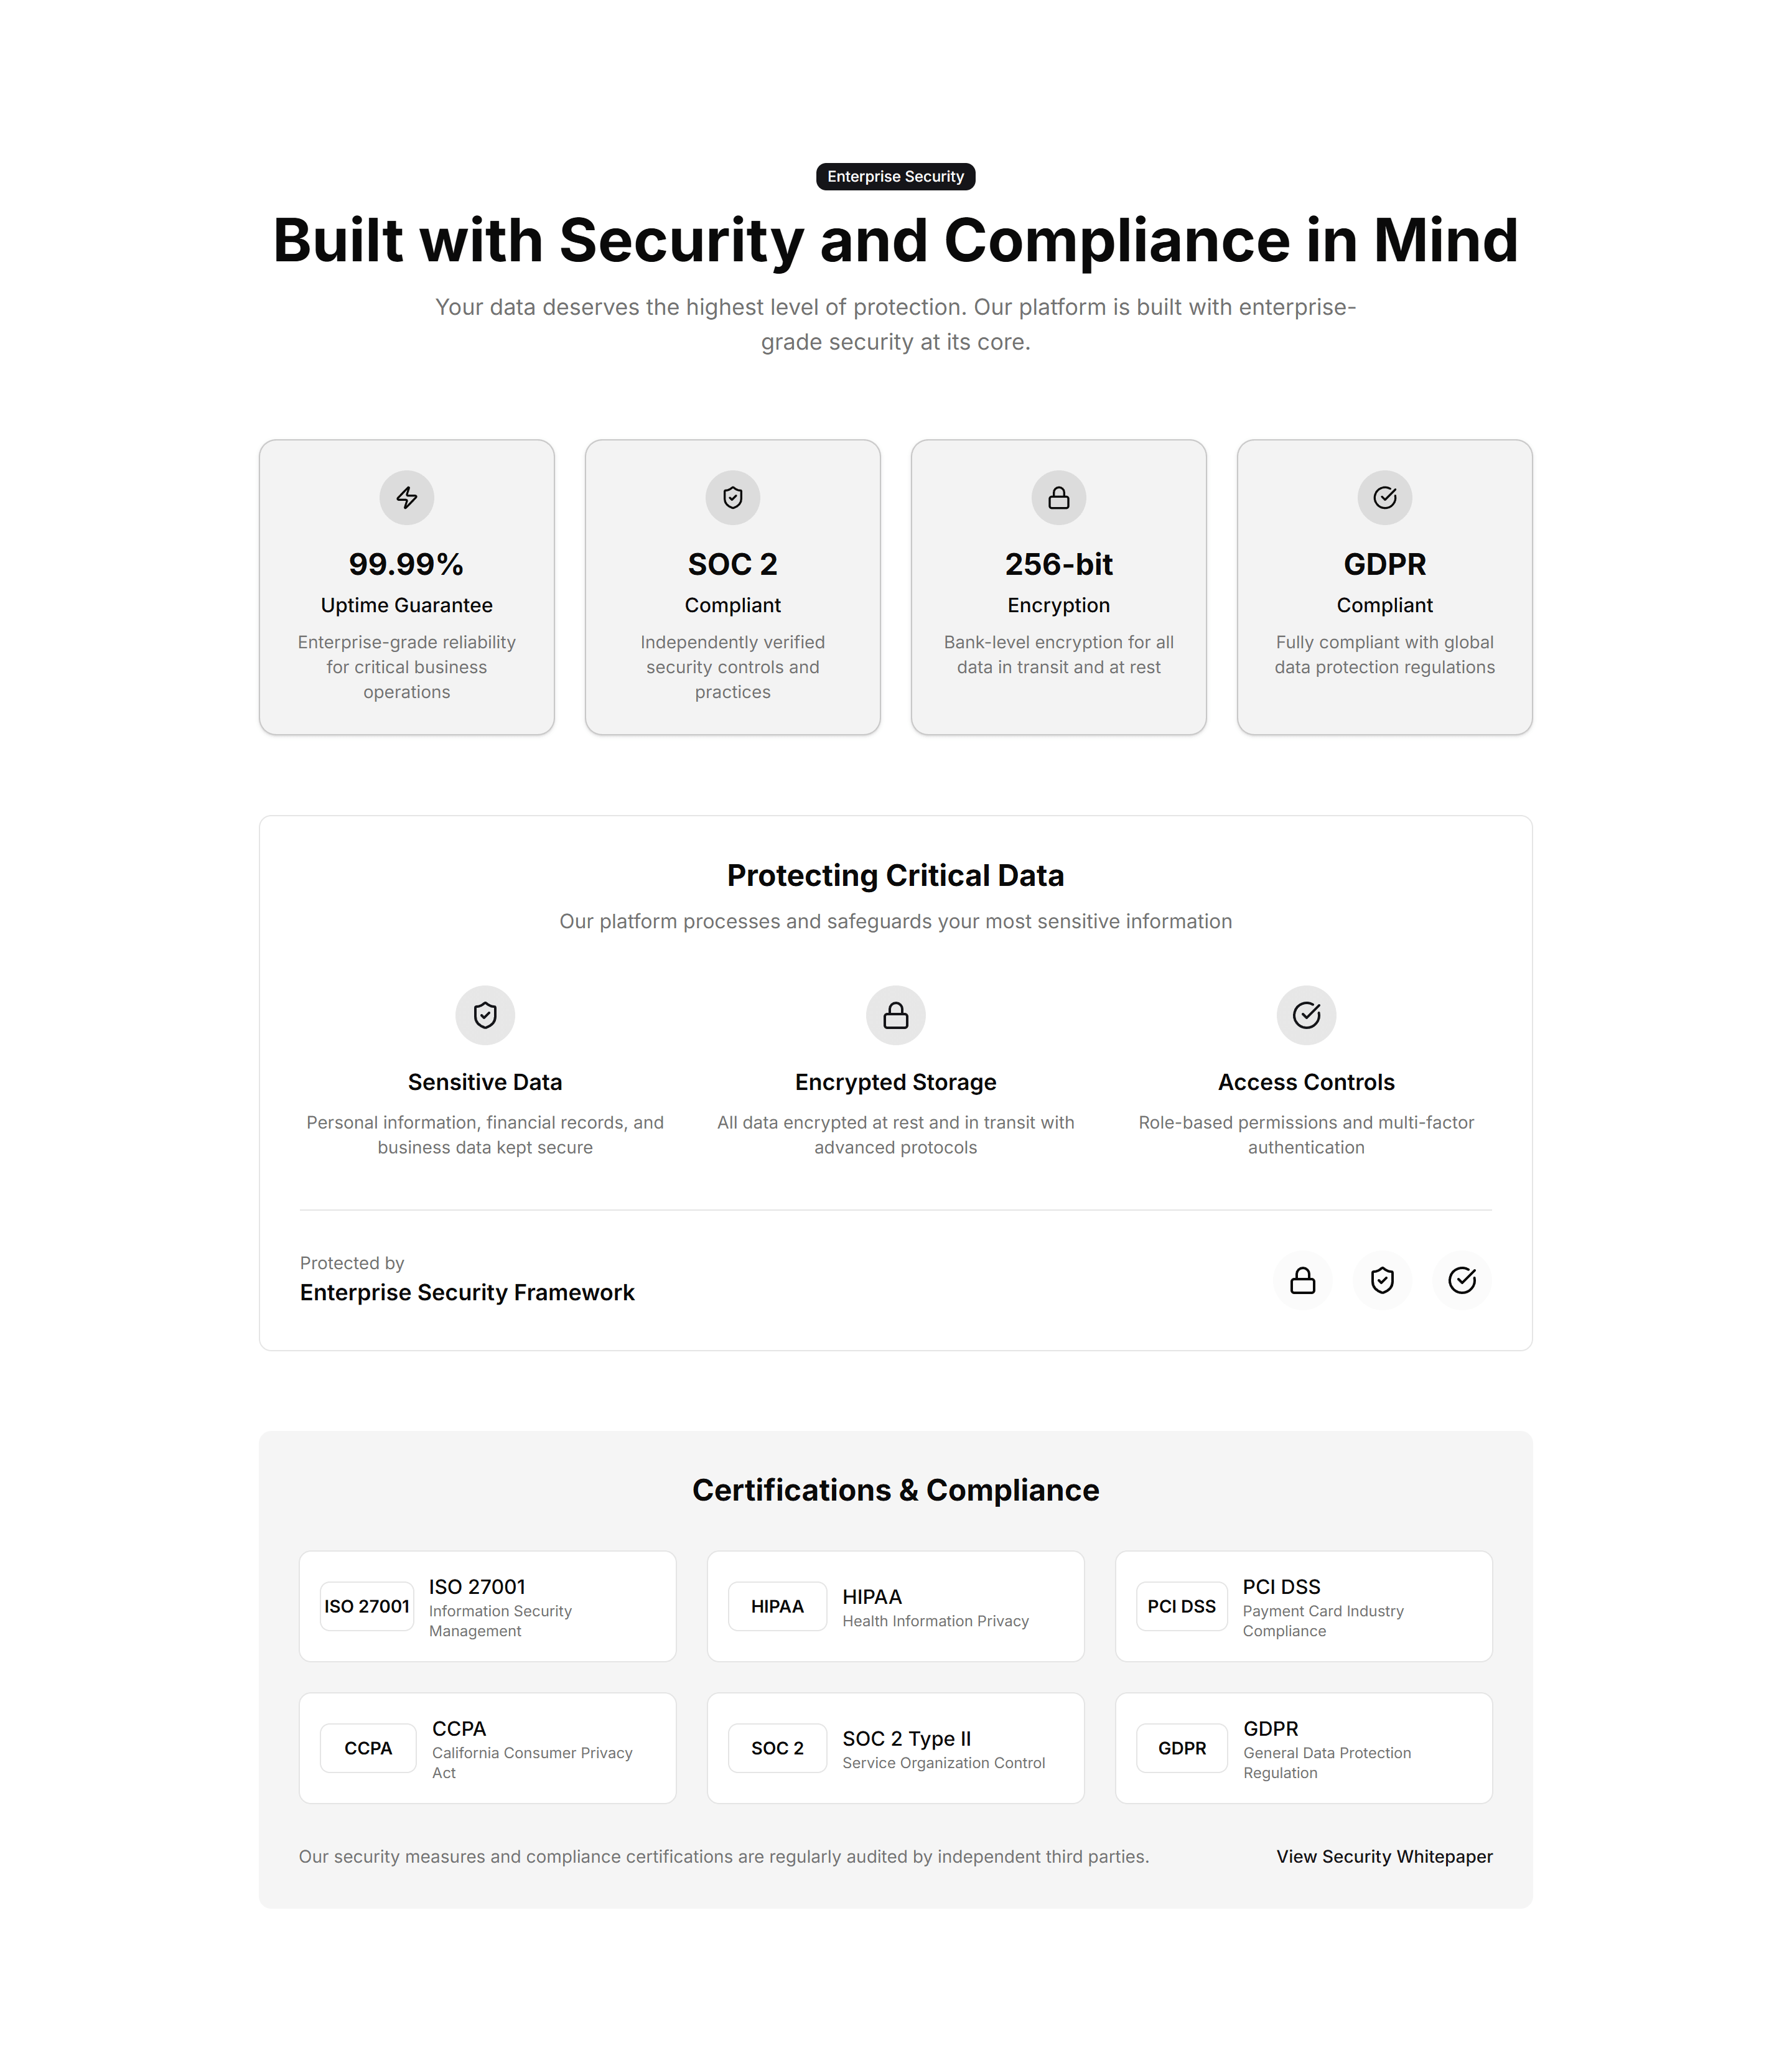
Marketing Stat: Trust Indicators
A band of proof points like uptime, customers, and ratings in one row. Use it near a signup form to reassure visitors and lift their confidence.
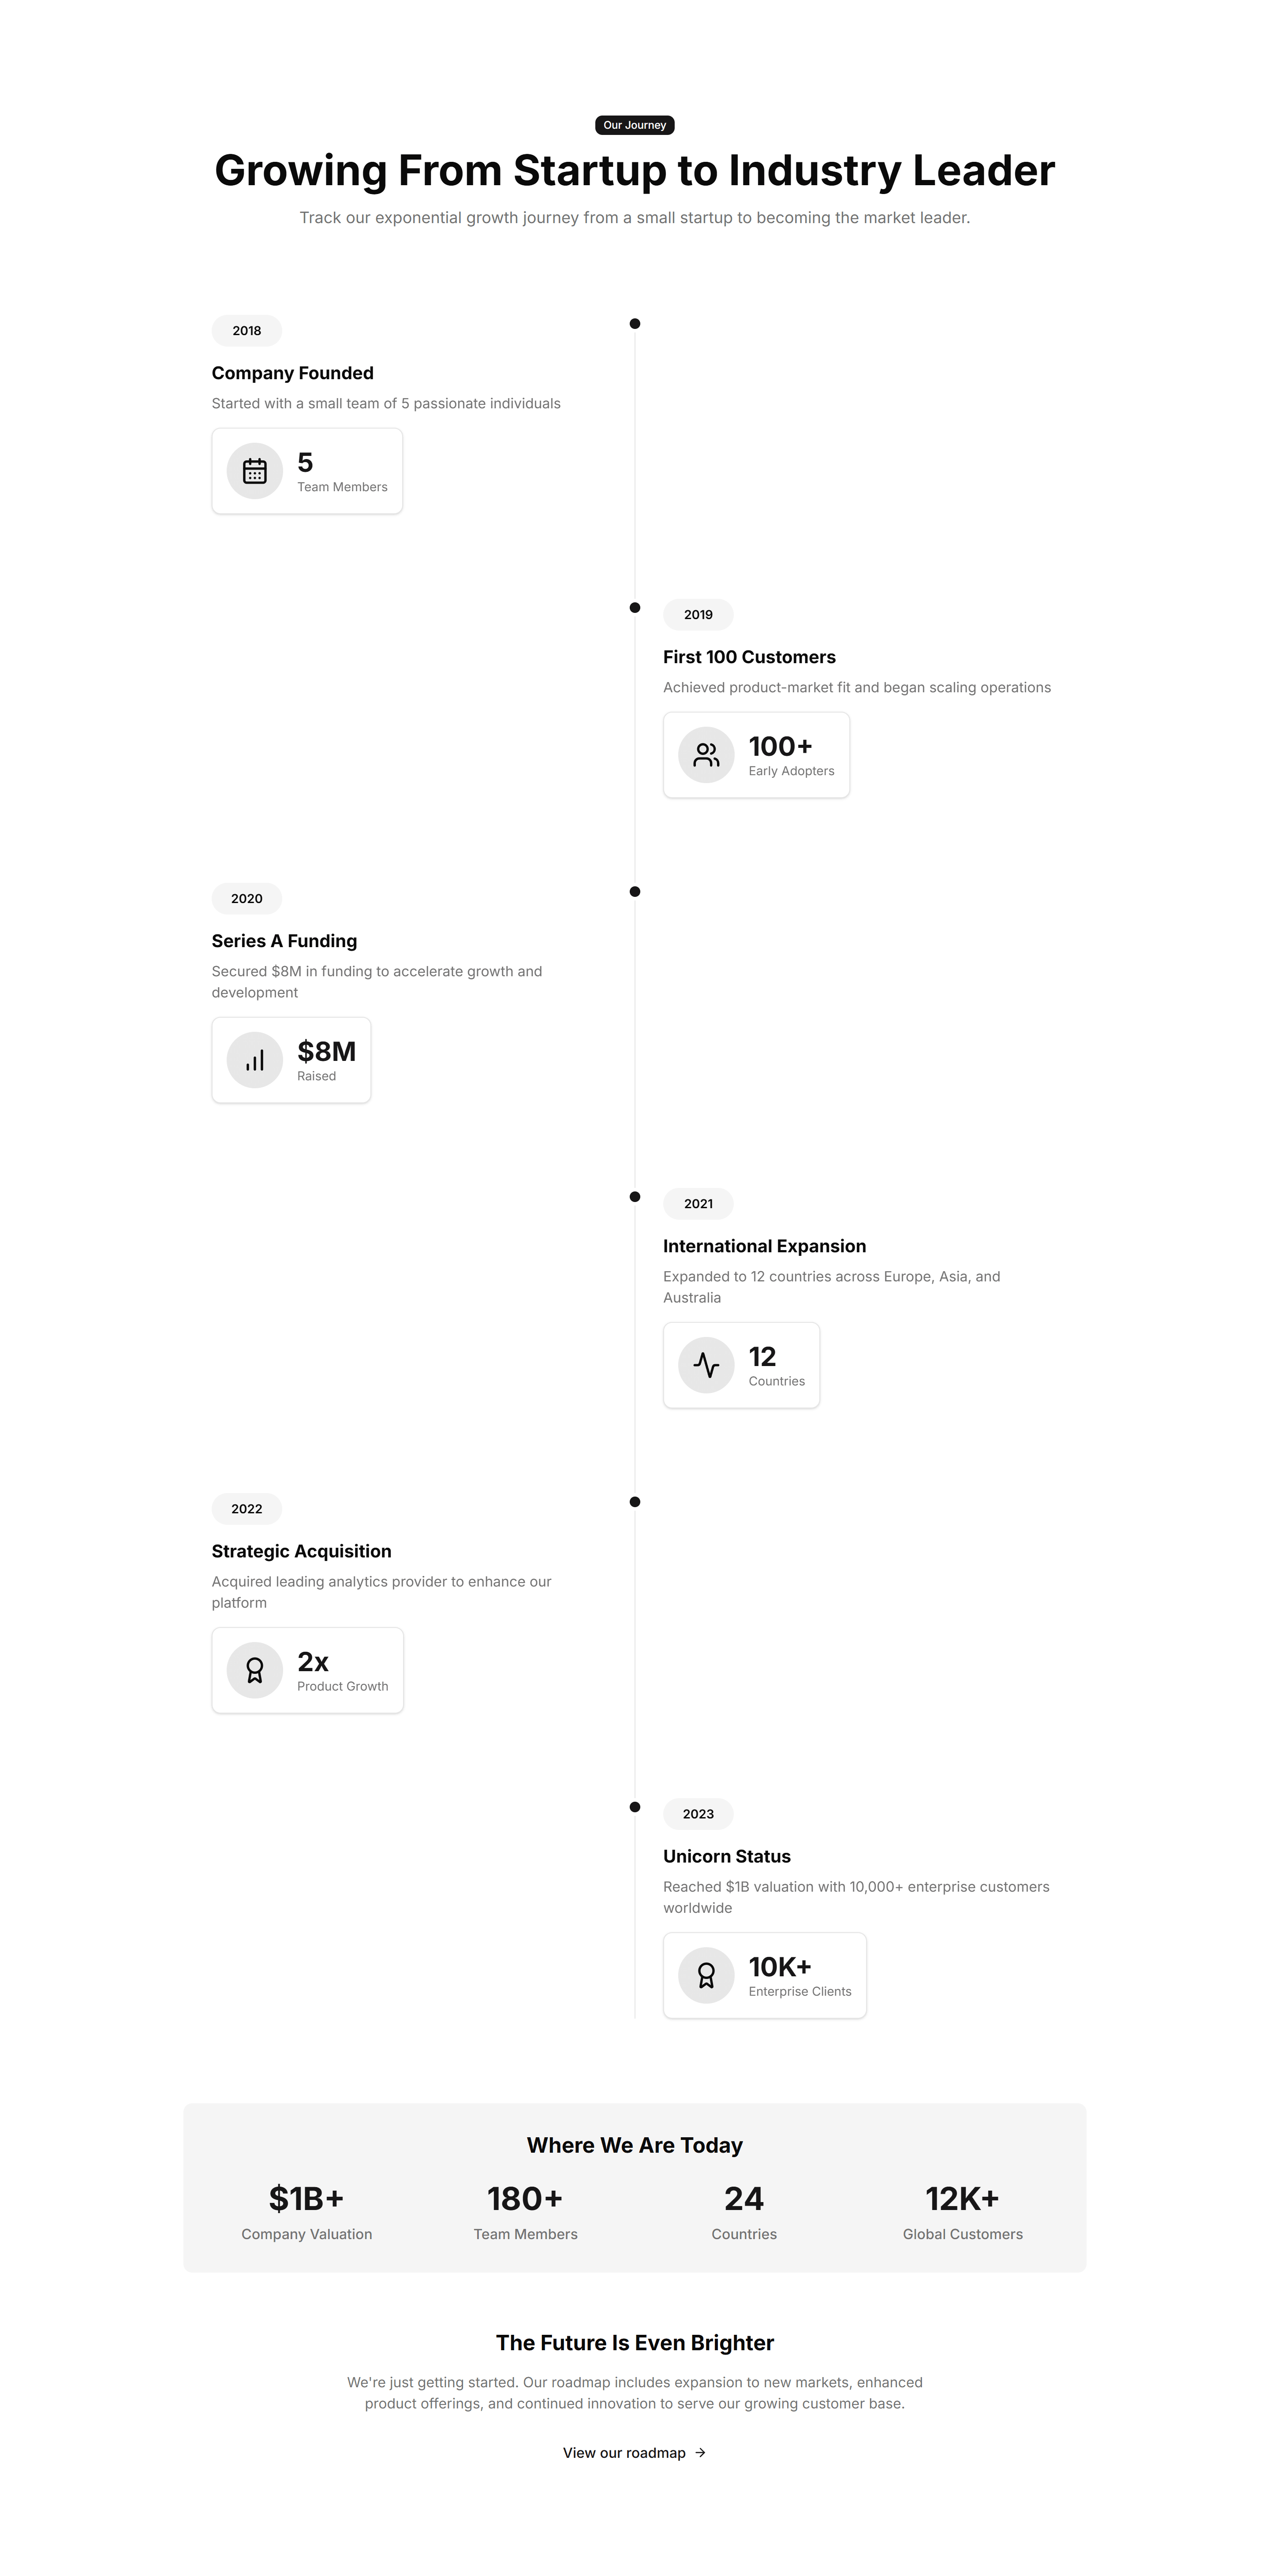
Marketing Stat: Growth Timeline
A vertical timeline pairing dates with the numbers you hit at each stage. Use it to chart company momentum on an about page or investor deck.
Marketing Stat: Card Group
A cluster of stat cards with a big number, label, and short caption in each. Use it to spotlight key metrics across a landing page in a clean grid.
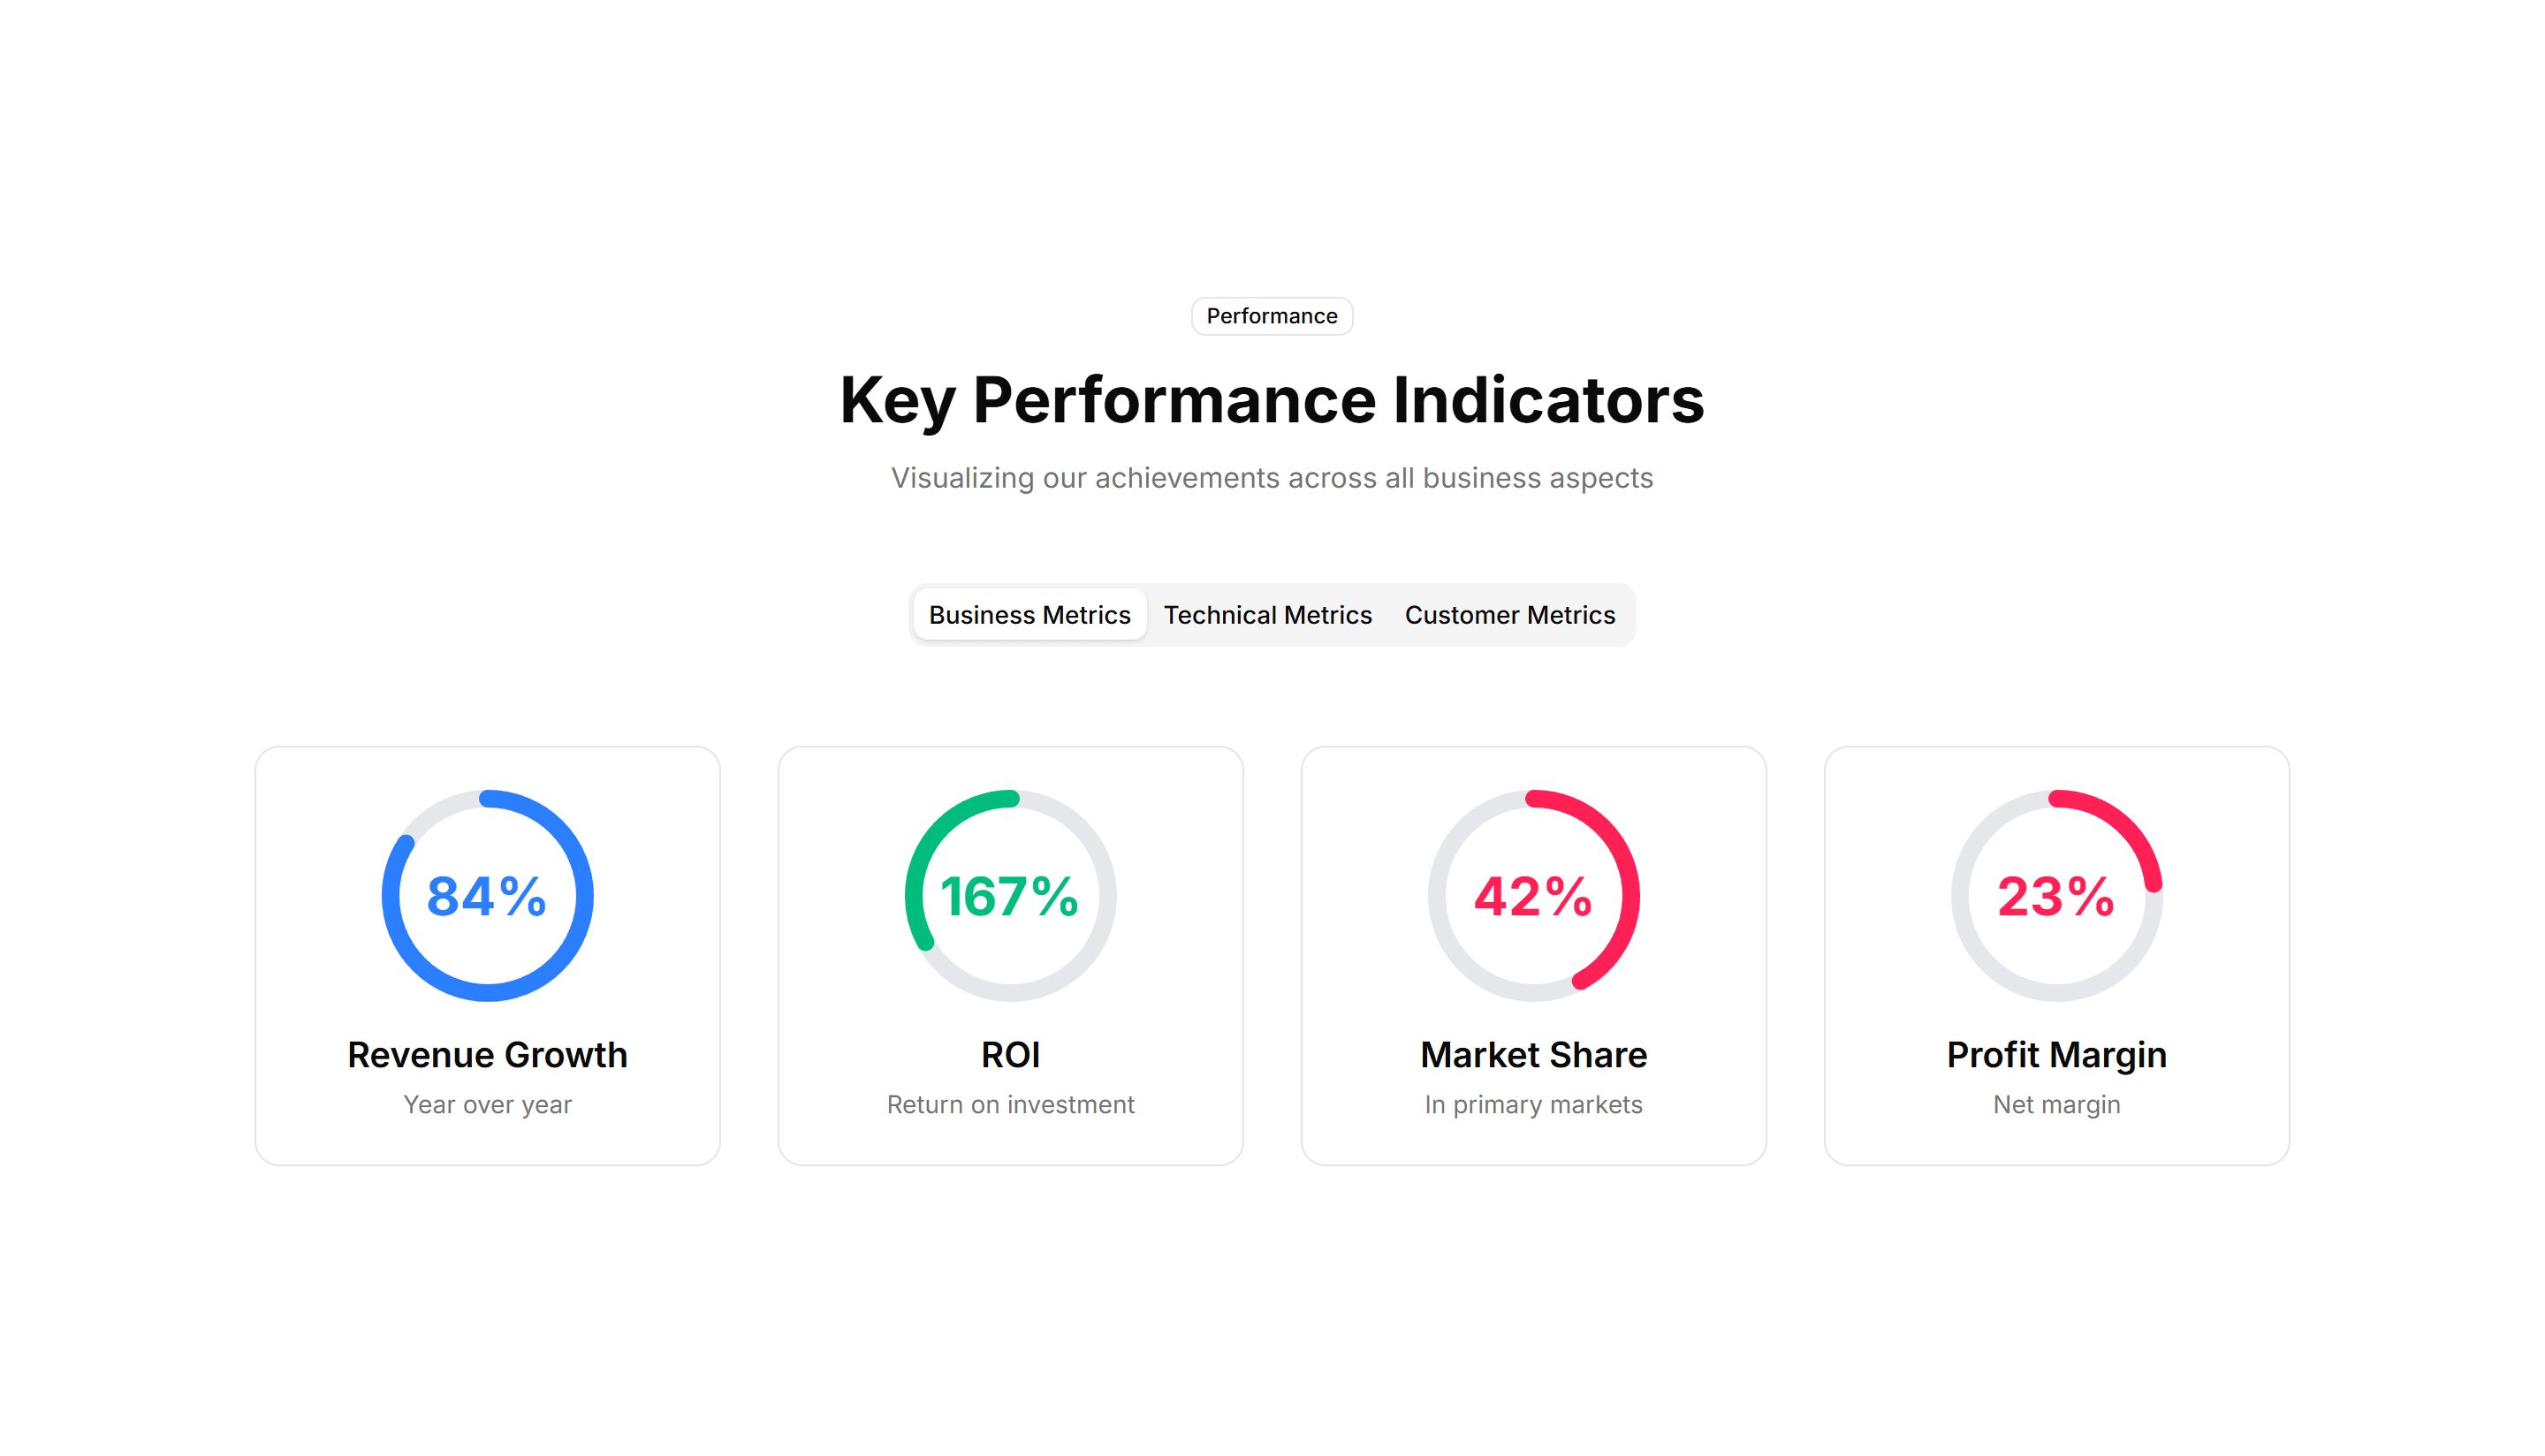
Marketing Stat: Circular Progress
Ring shaped progress dials that animate to a percentage value. Good for dashboards or landing pages that report completion rates and capacity at a glance.
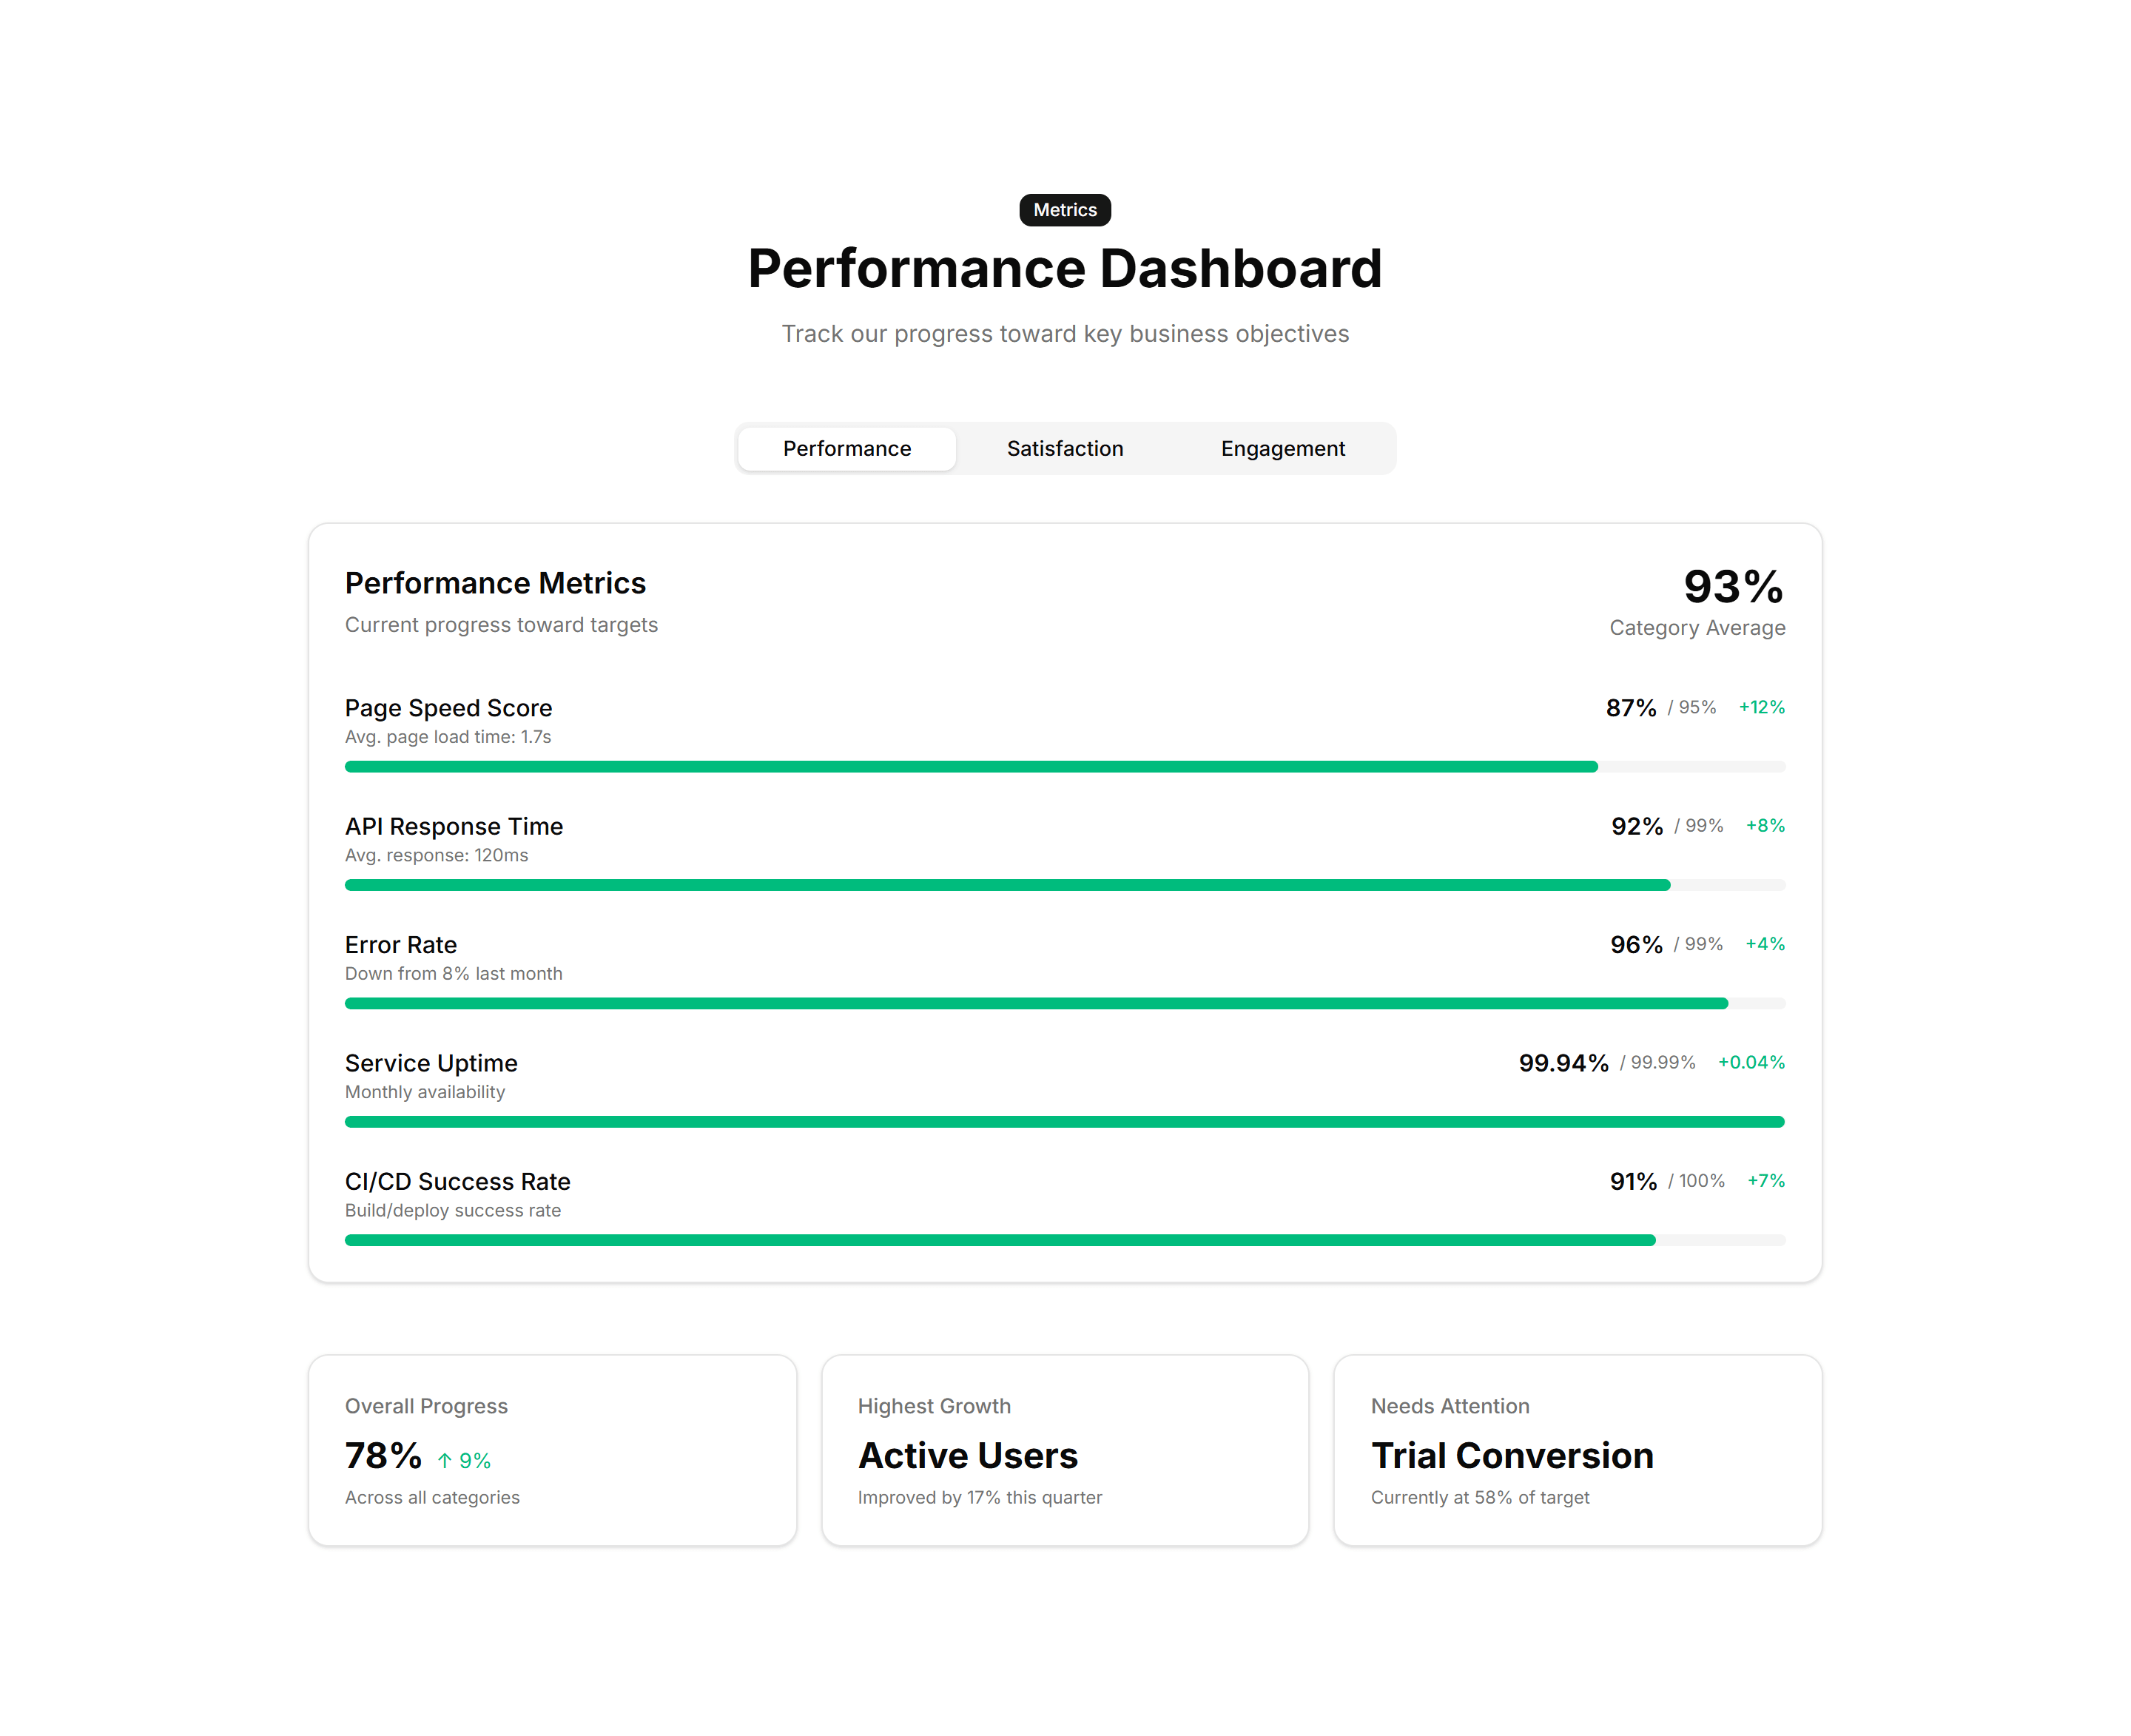
Marketing Stat: Progress Bars
Labeled bars that fill to a percentage to track adoption or completion. Use it on a status page or report to show how far each goal has come.
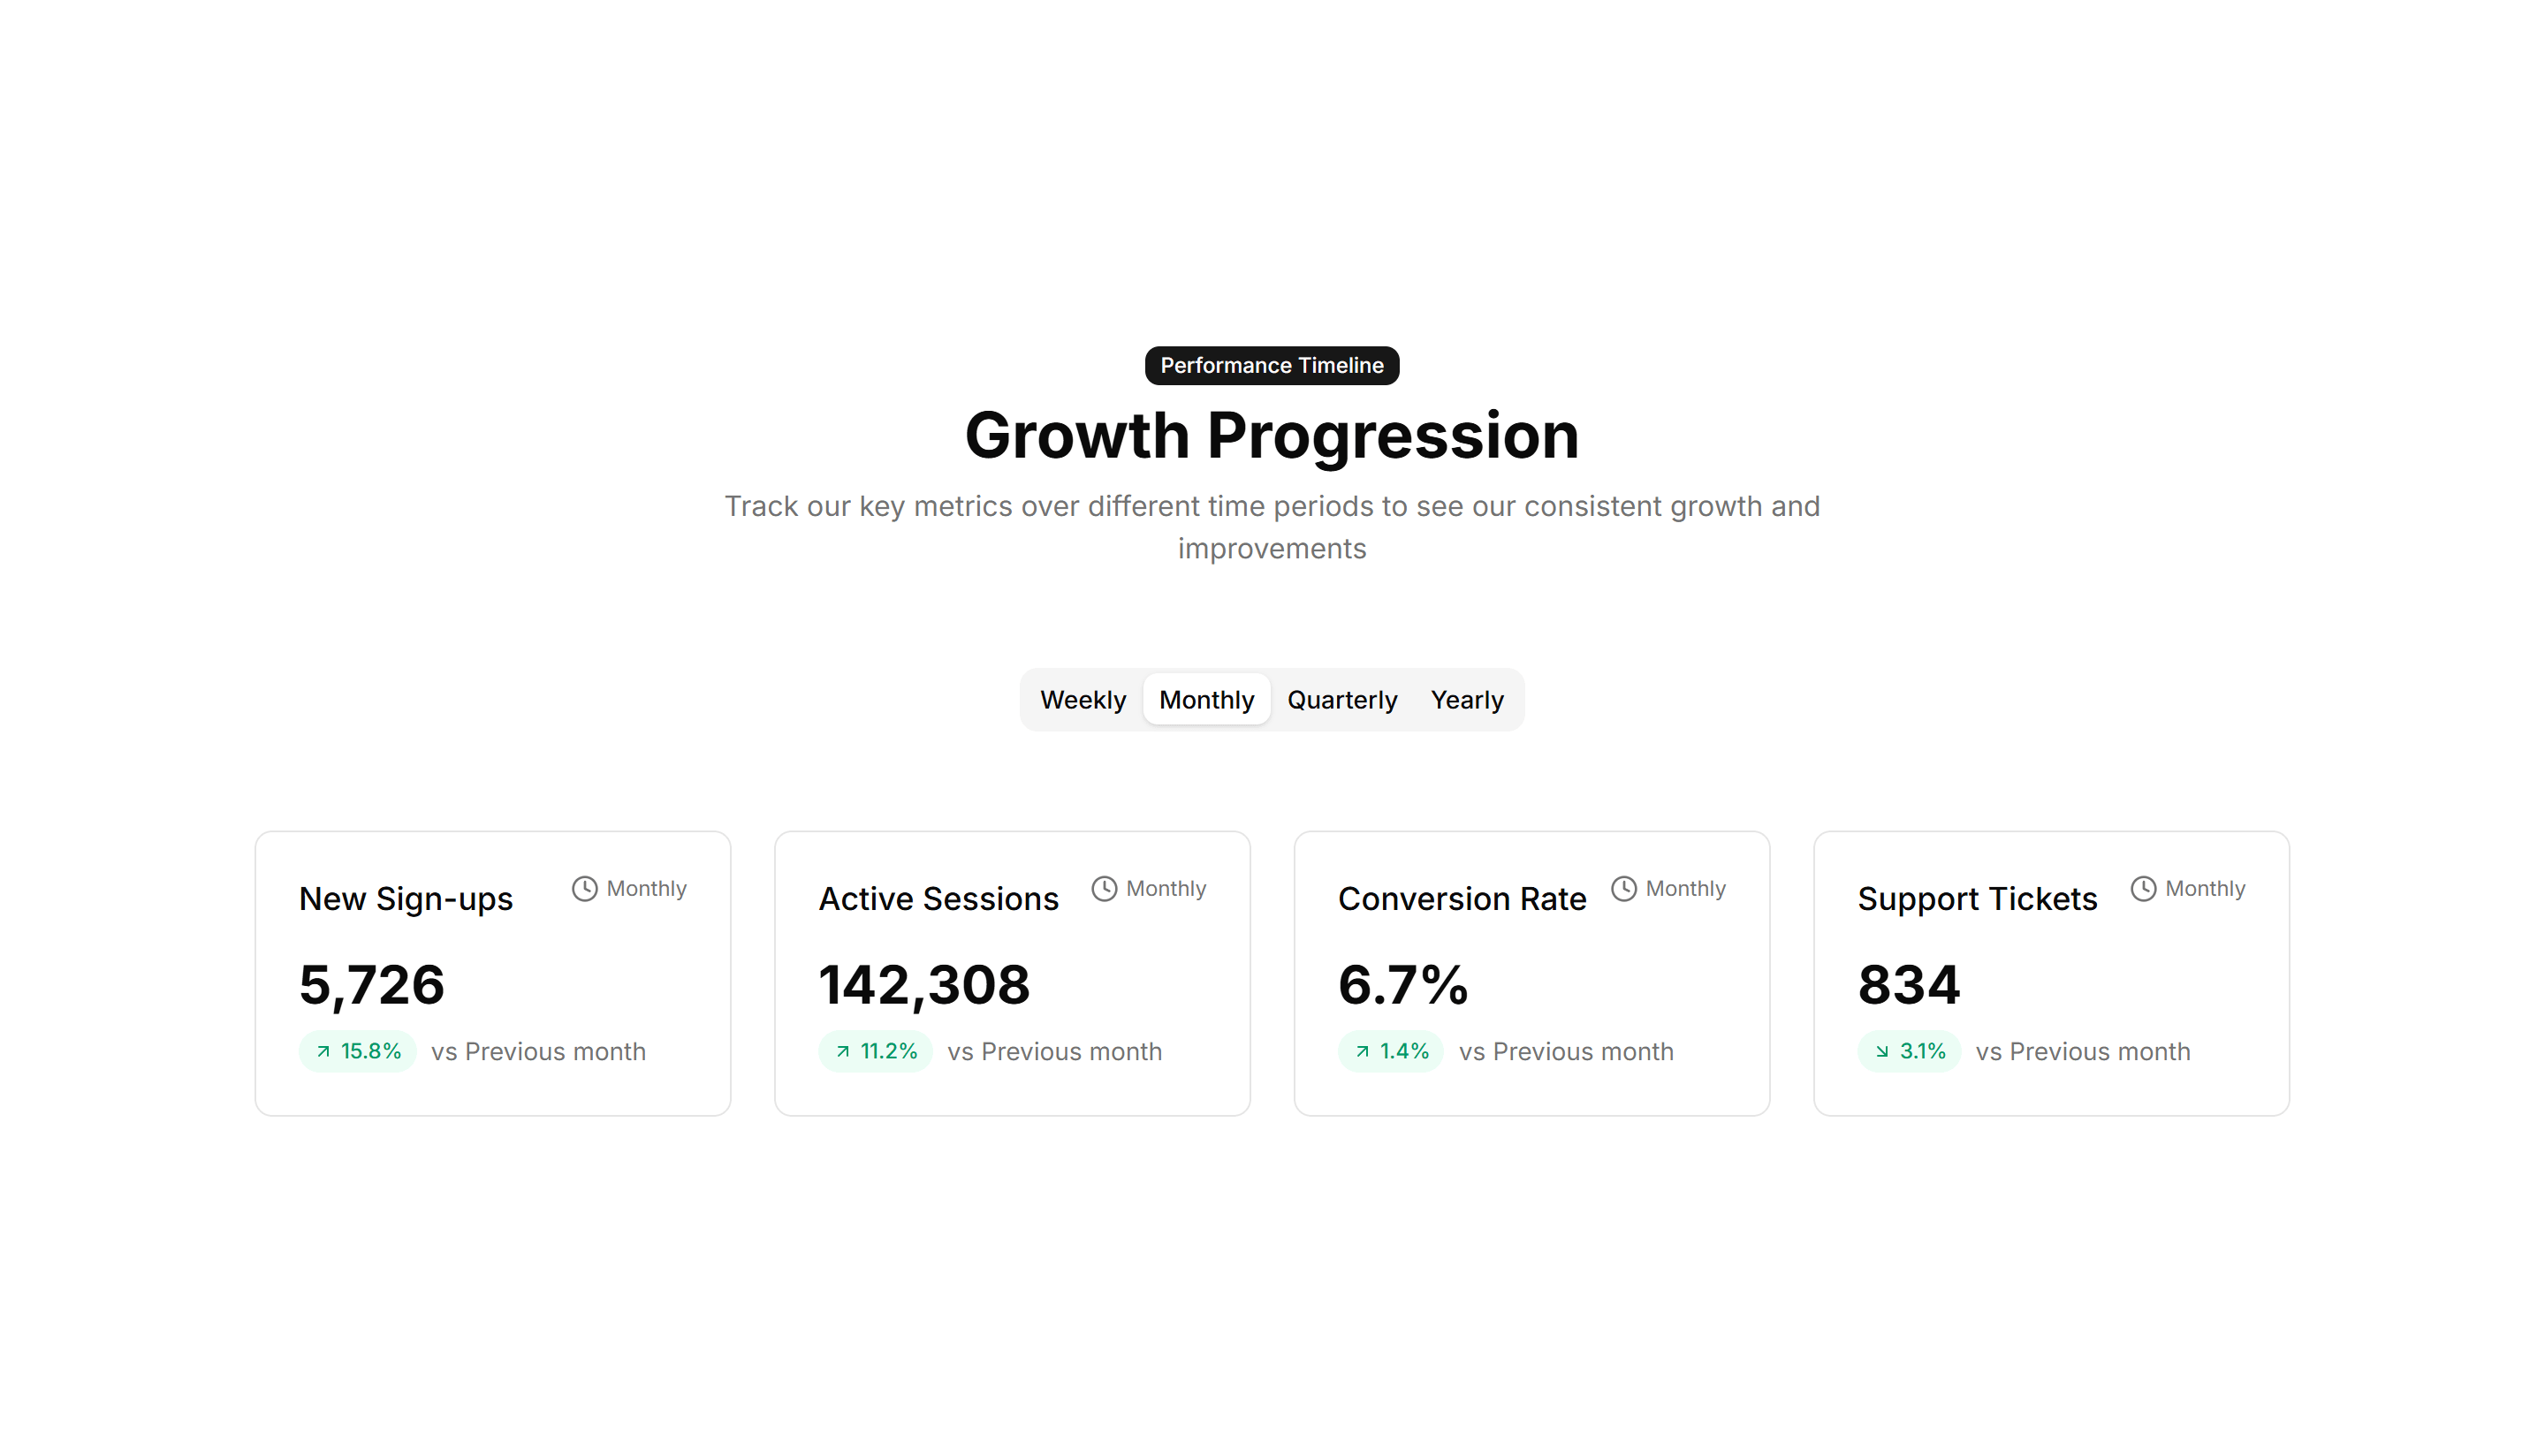
Marketing Stat: Timeline Stats
Key numbers plotted along a horizontal timeline of moments and dates. Use it to tell a growth story across quarters on an about or press page.
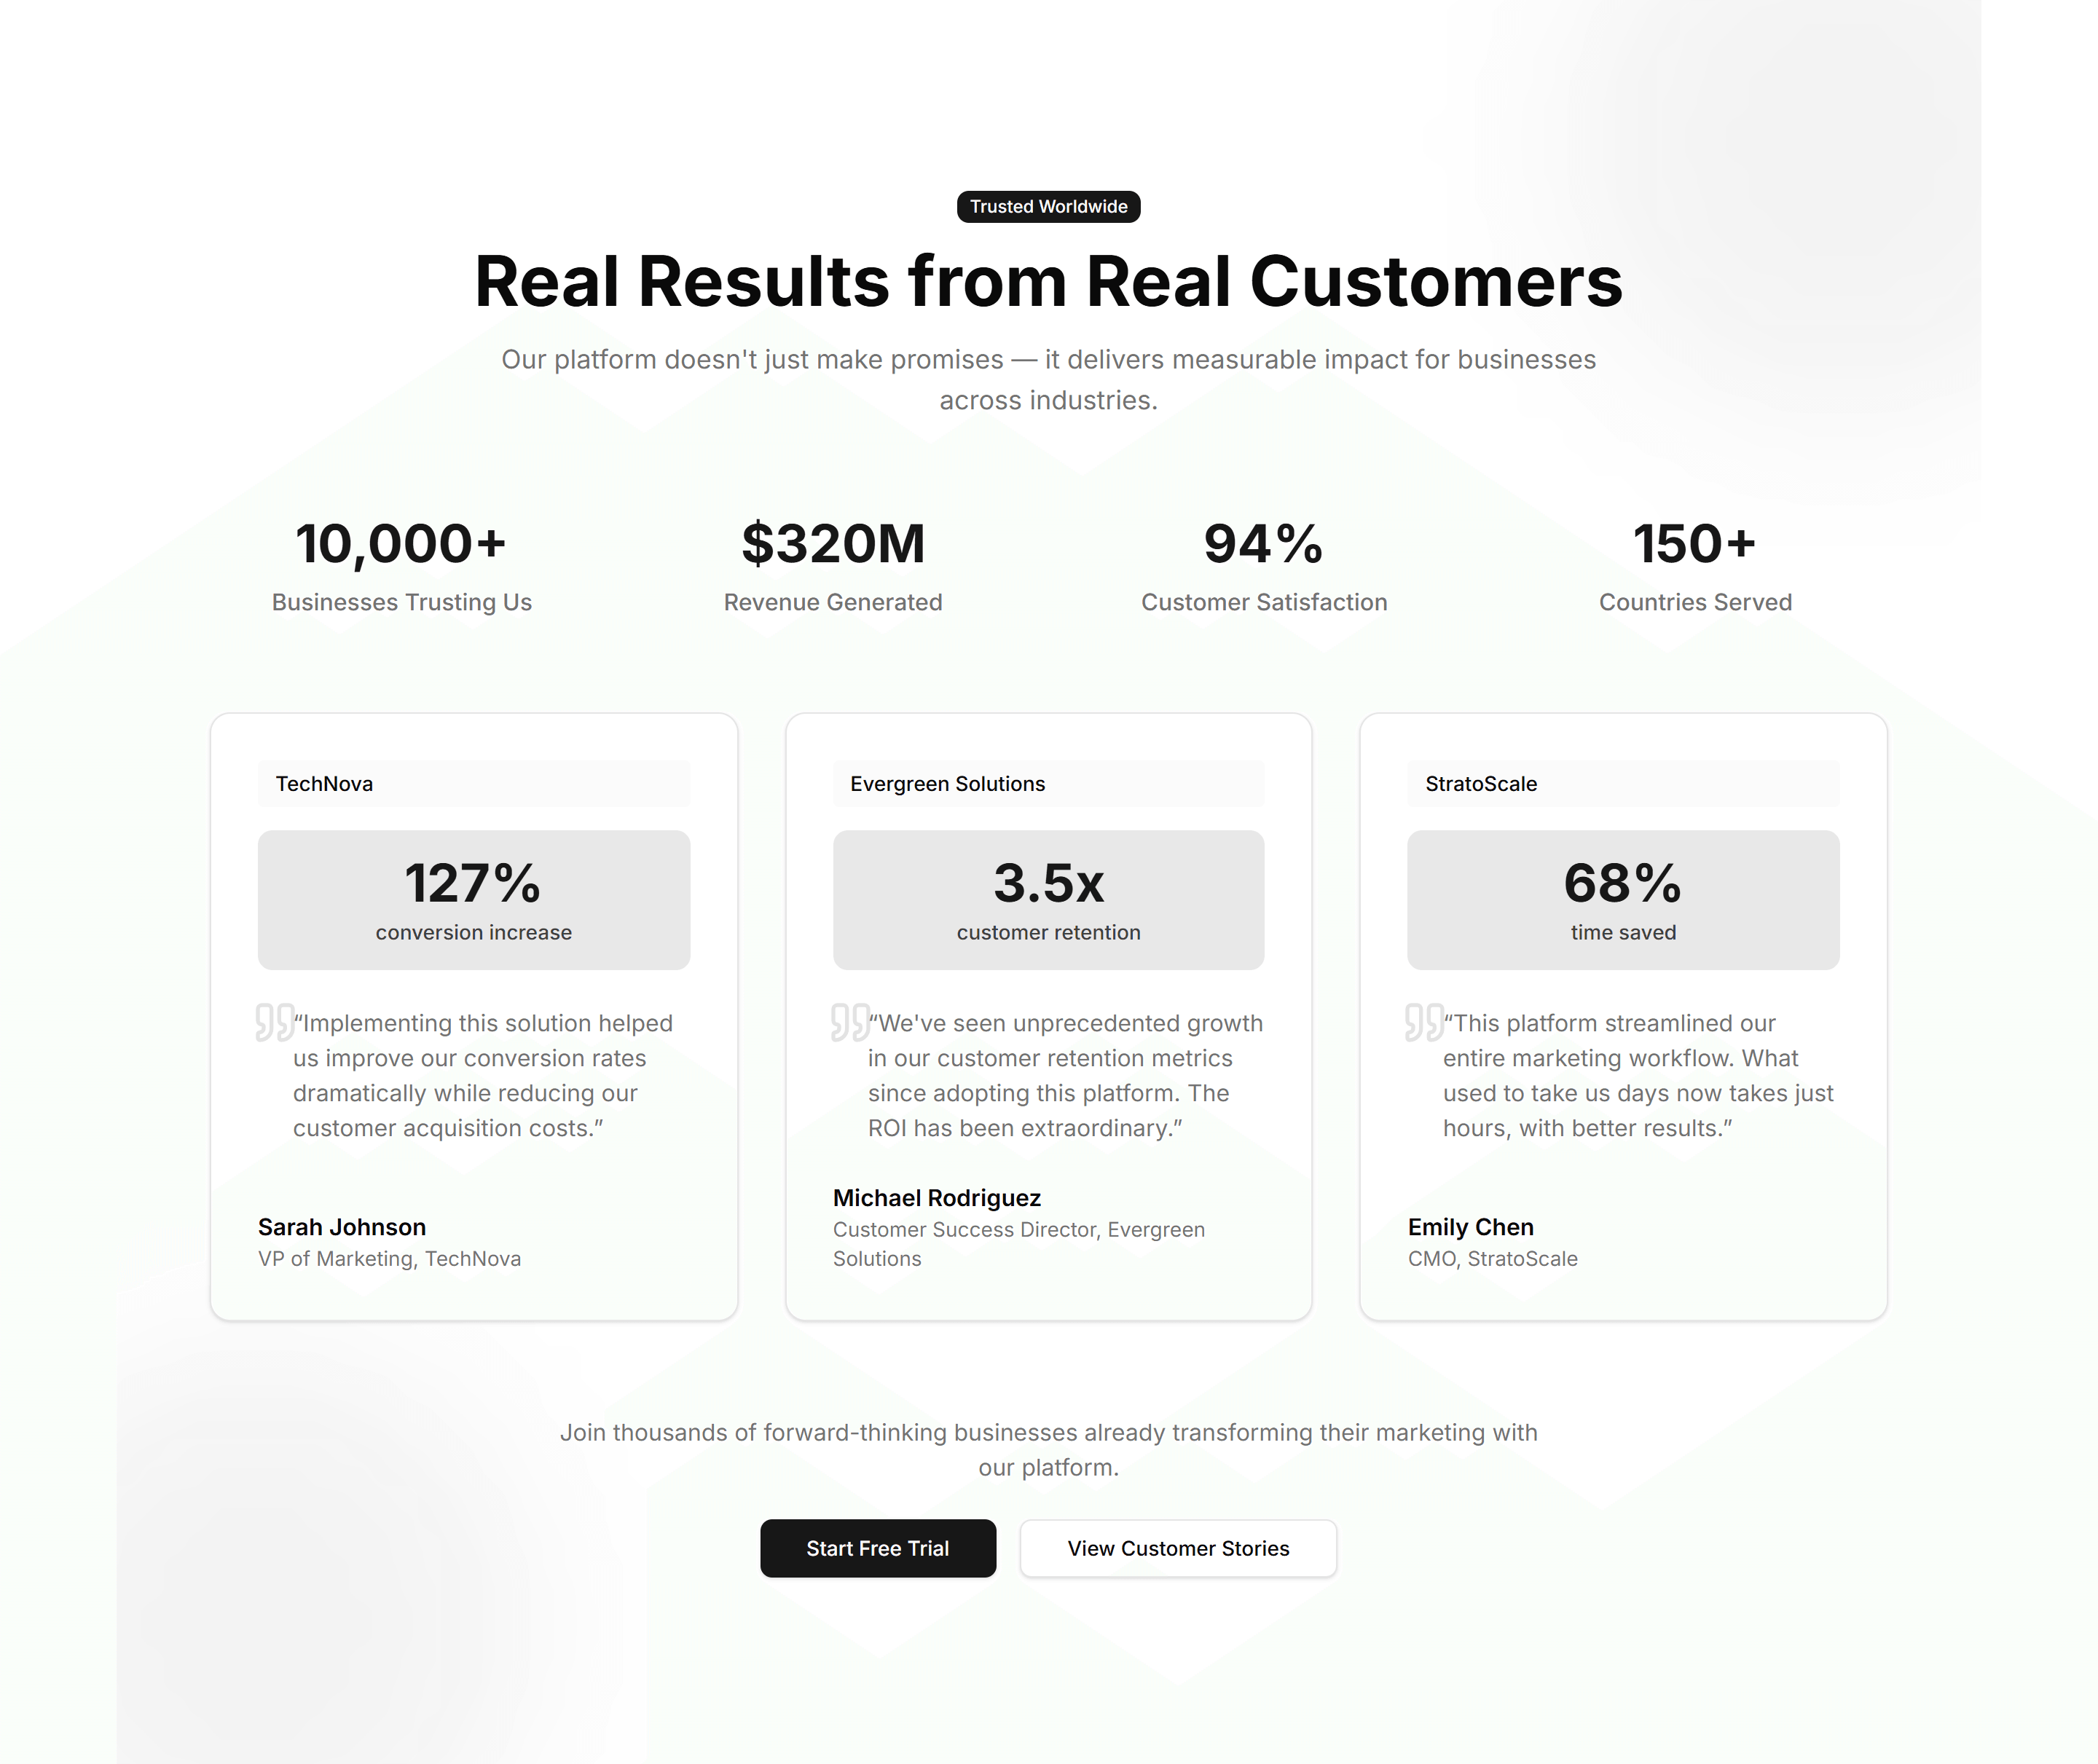
Marketing Stat: Customer Testimonial
A quote from a customer next to the numbers their team reached with you. Use it to pair social proof with hard results on a case study page.
Marketing Stat: Gradient Grid
A grid of stat tiles washed in soft gradients for a vivid, modern look. Use it to display headline metrics when you want the section to feel premium.
Marketing Stat: Impact Numbers
Oversized counters that animate upward as the section scrolls into view. Use it to make reach, users, or revenue feel bold and immediate to readers.
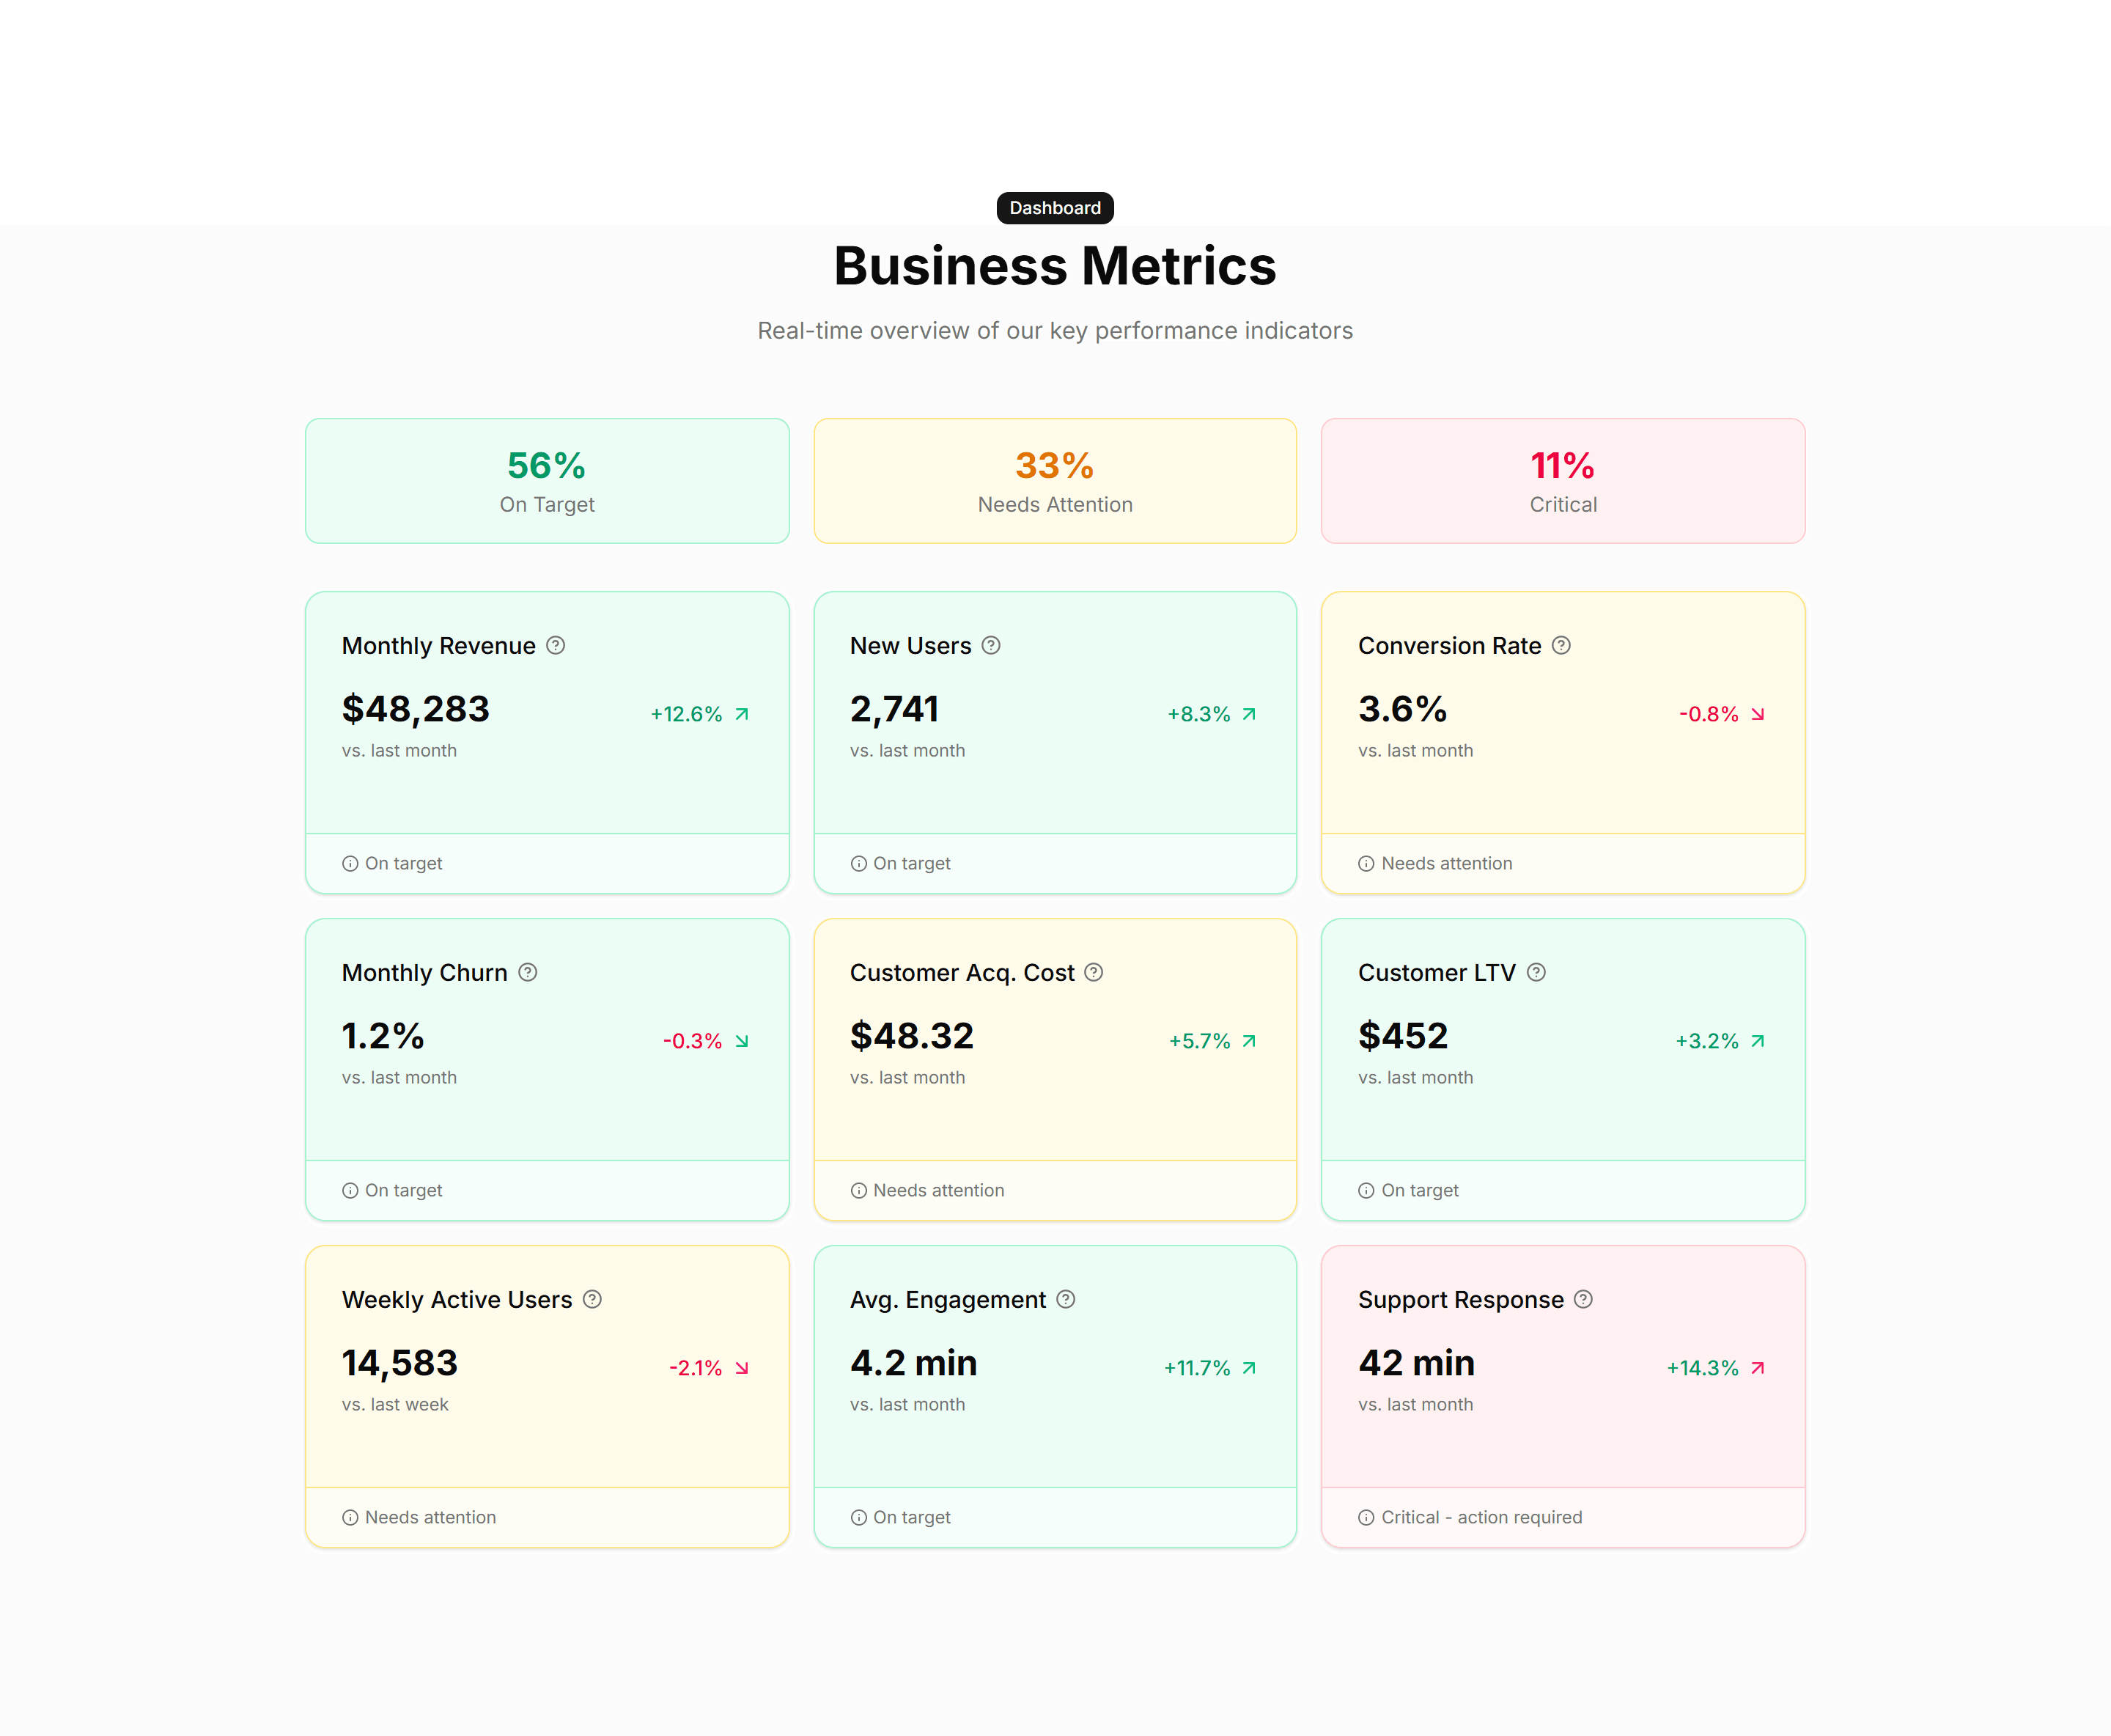
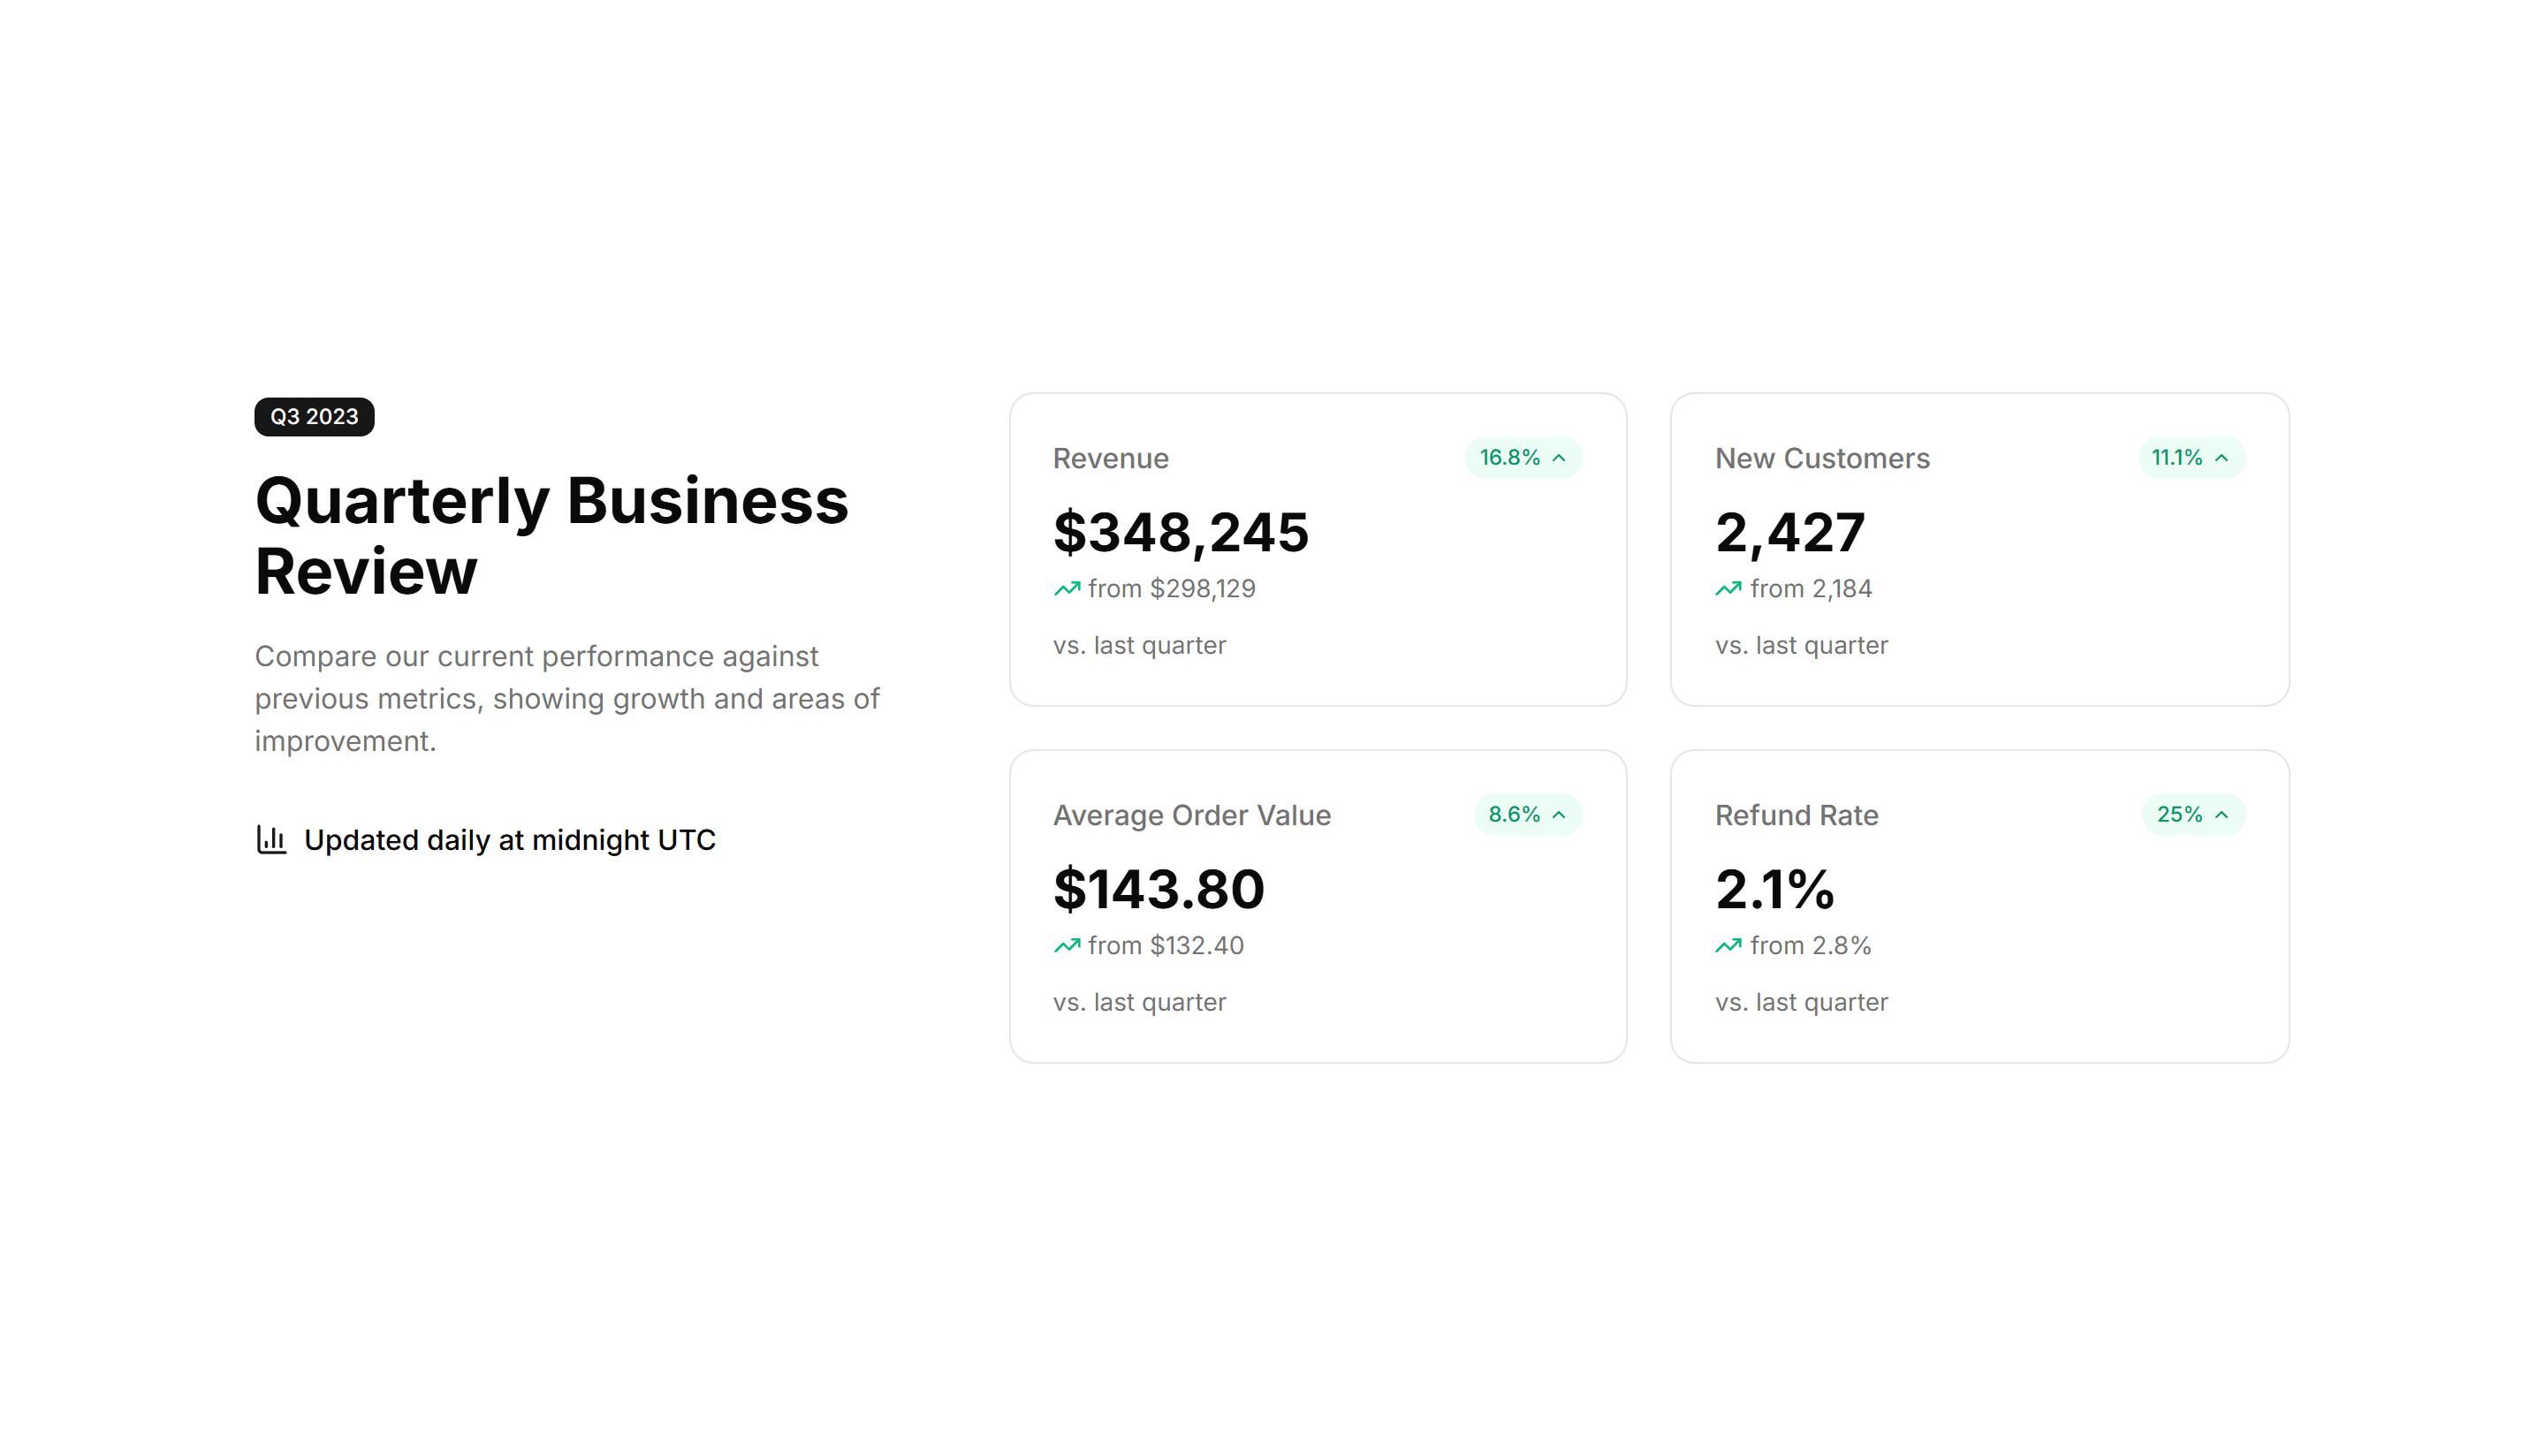
Marketing Stat: Metric Cards
Bordered cards each holding one metric, a label, and a trend note. Use it to report KPIs in a structured layout on a homepage or product page.
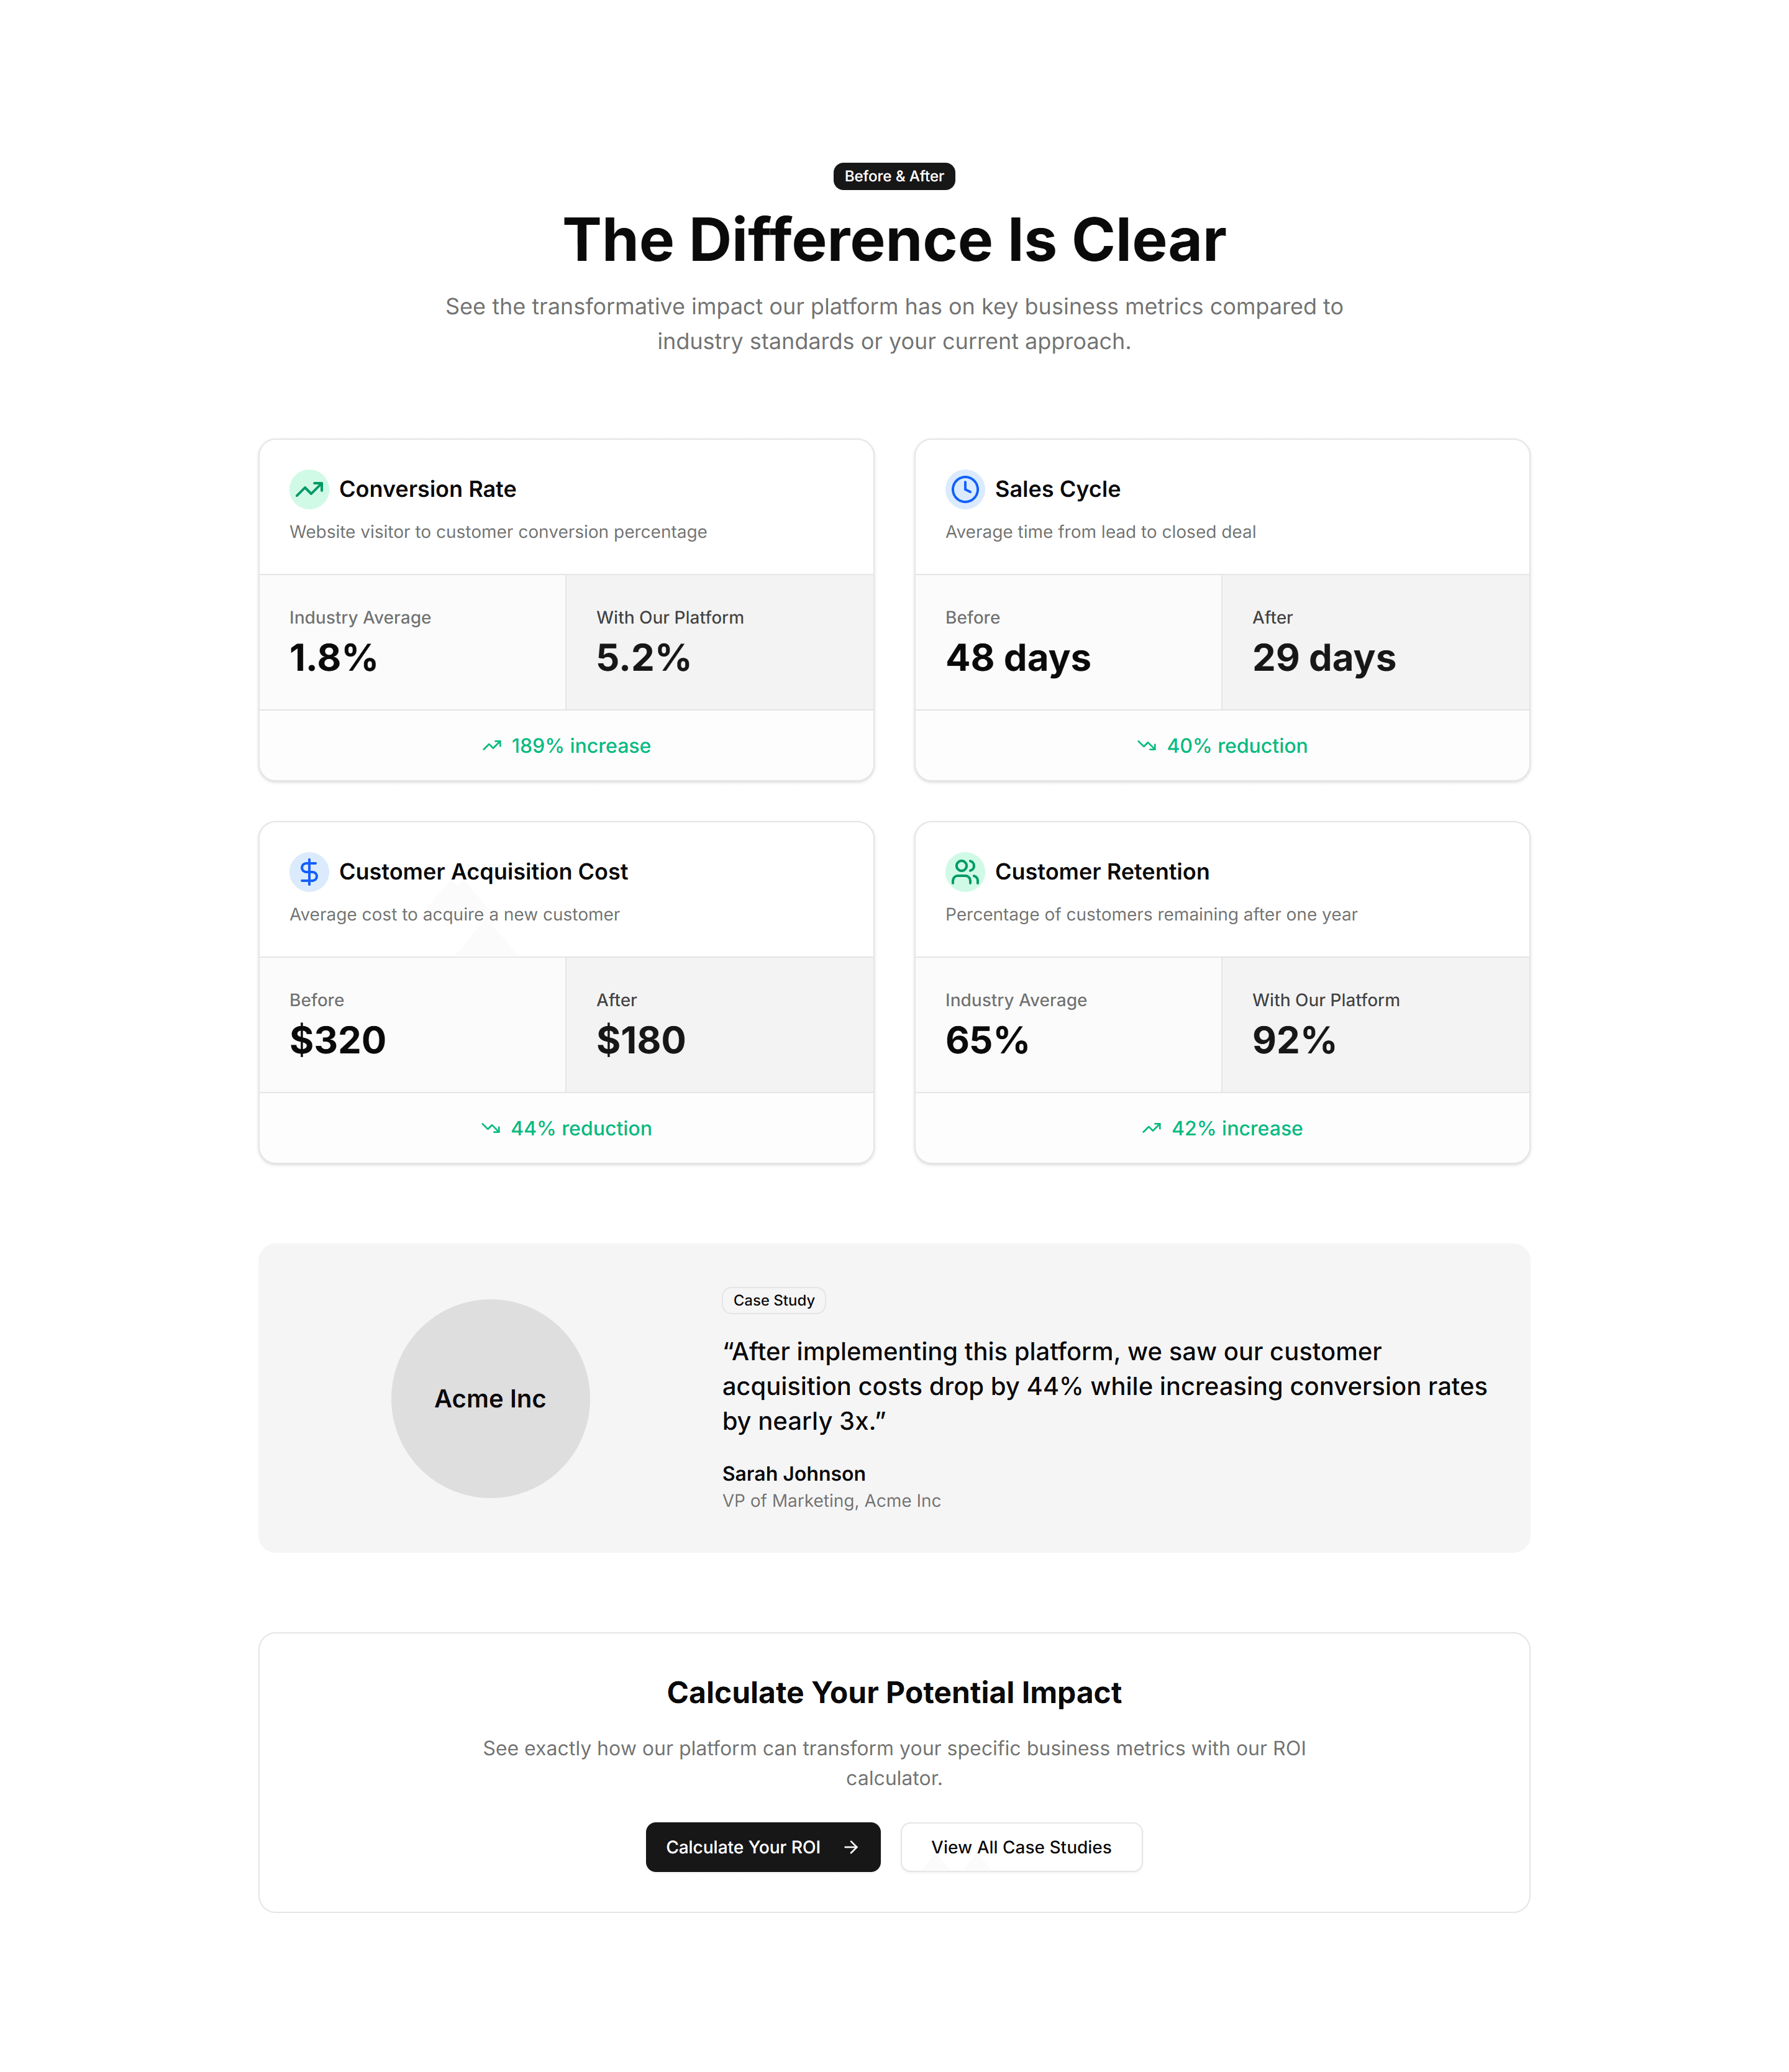
Marketing Stat: Comparison Metrics
Two columns of numbers placed side by side to contrast before and after results. Use it to show the lift your product delivers over the old way.
Marketing Stat: Simple 3 Cols
Three evenly spaced columns each with a number and a short label below. Use it for a clean, balanced stats strip on any marketing or about page.
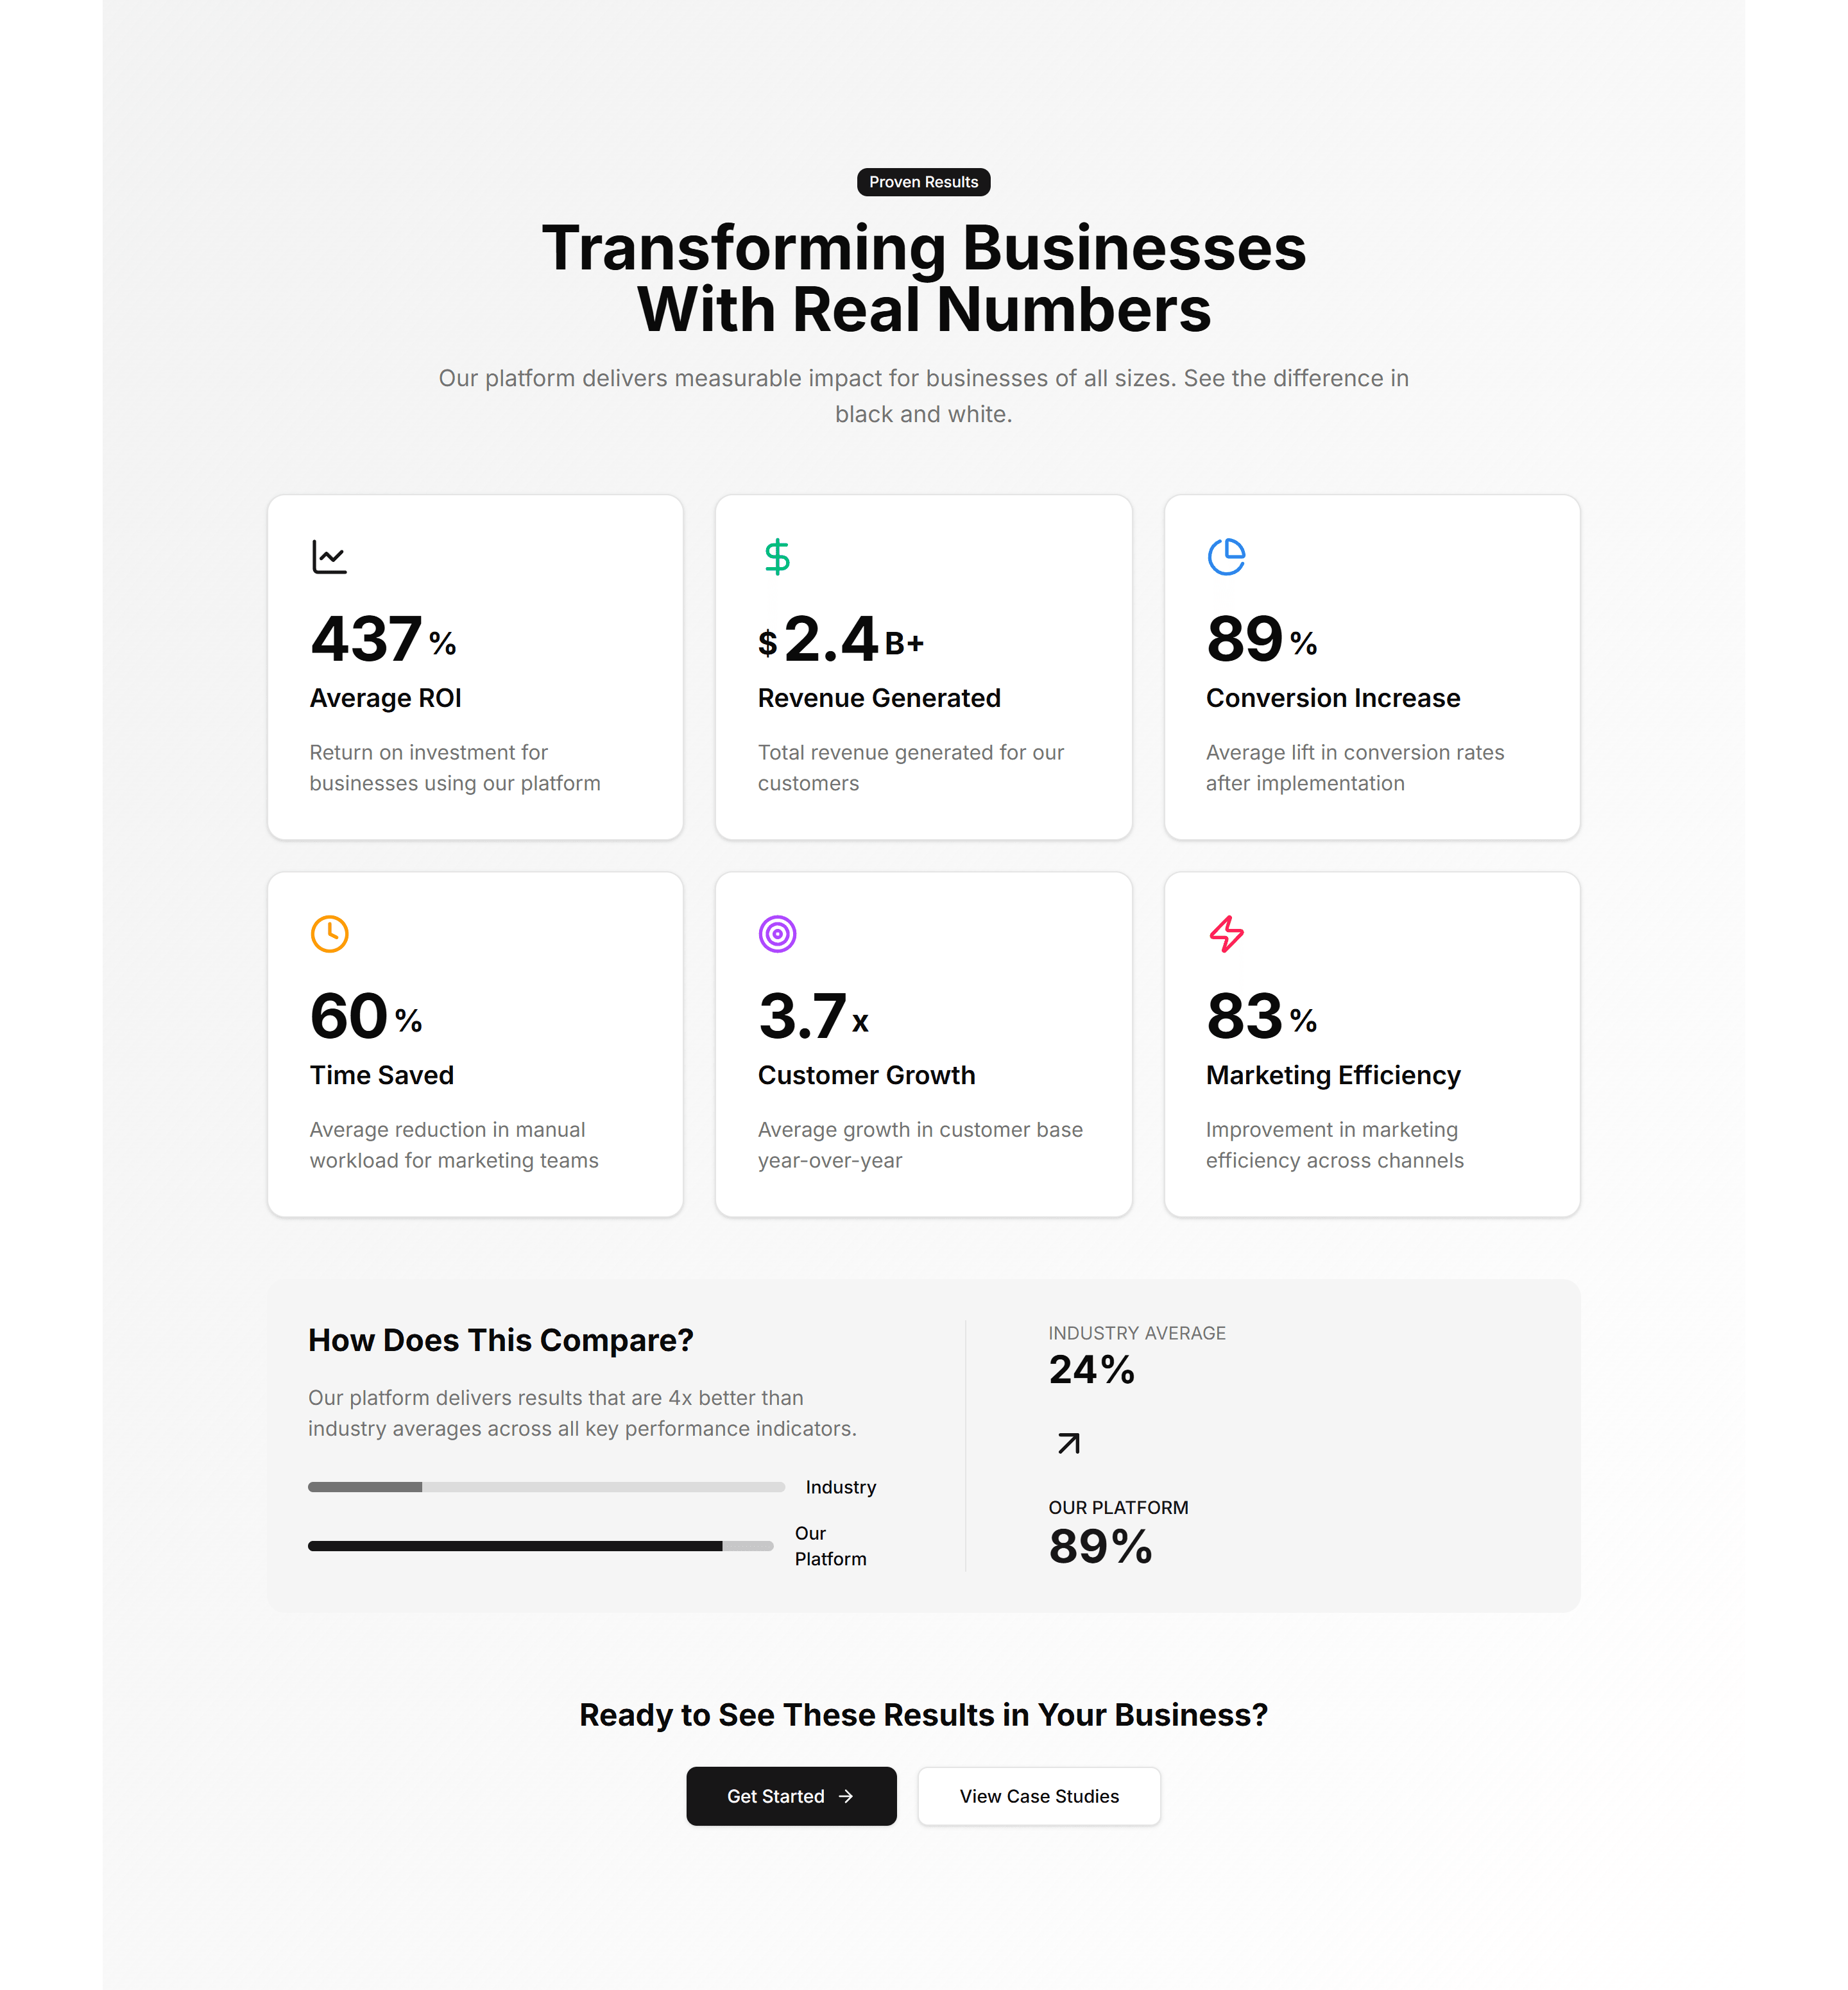
Marketing Stat: Stats With Icons
Each figure sits beside an icon that signals what the number measures. Use it to make a stats row scannable and add visual cues to every metric.
Marketing Stat: Comparison Stats
Paired figures with labels that weigh your offering against a baseline. Great for sales pages that need to make the gain feel concrete and credible.
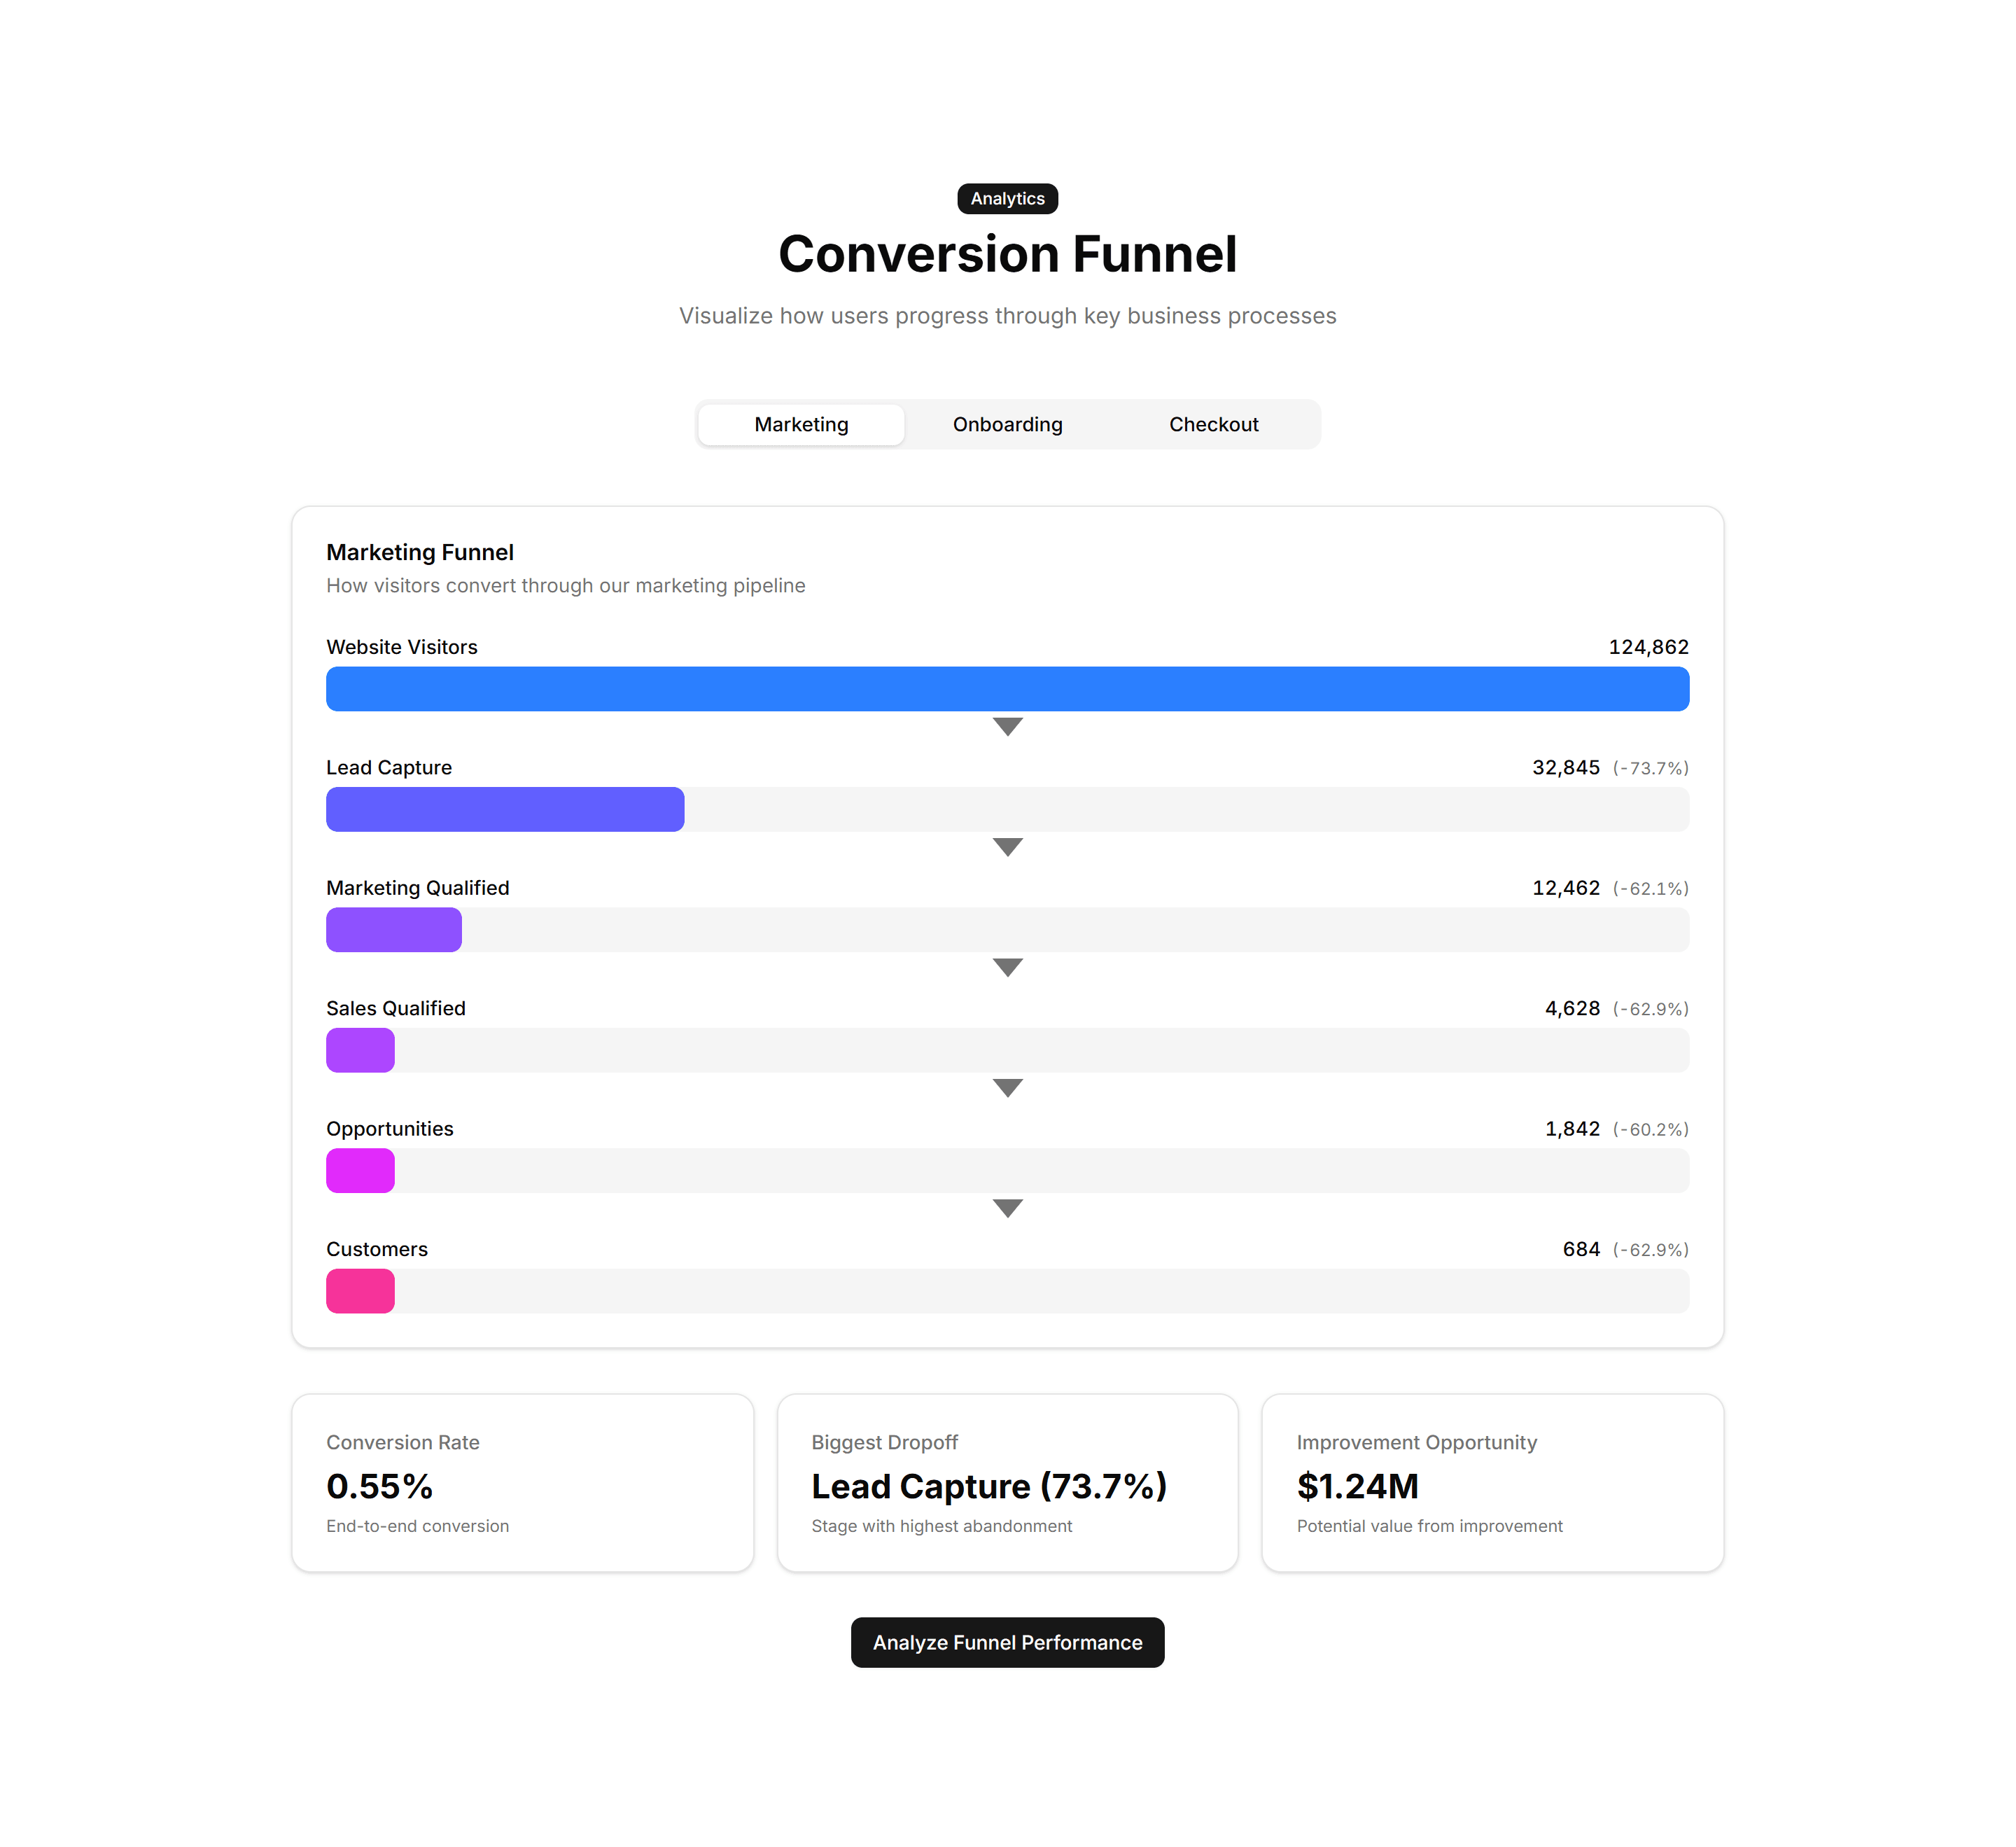
Marketing Stat: Funnel Stats
A stepped funnel showing how many visitors move from view to signup to paid. Use it to explain conversion and where users drop off in your flow.
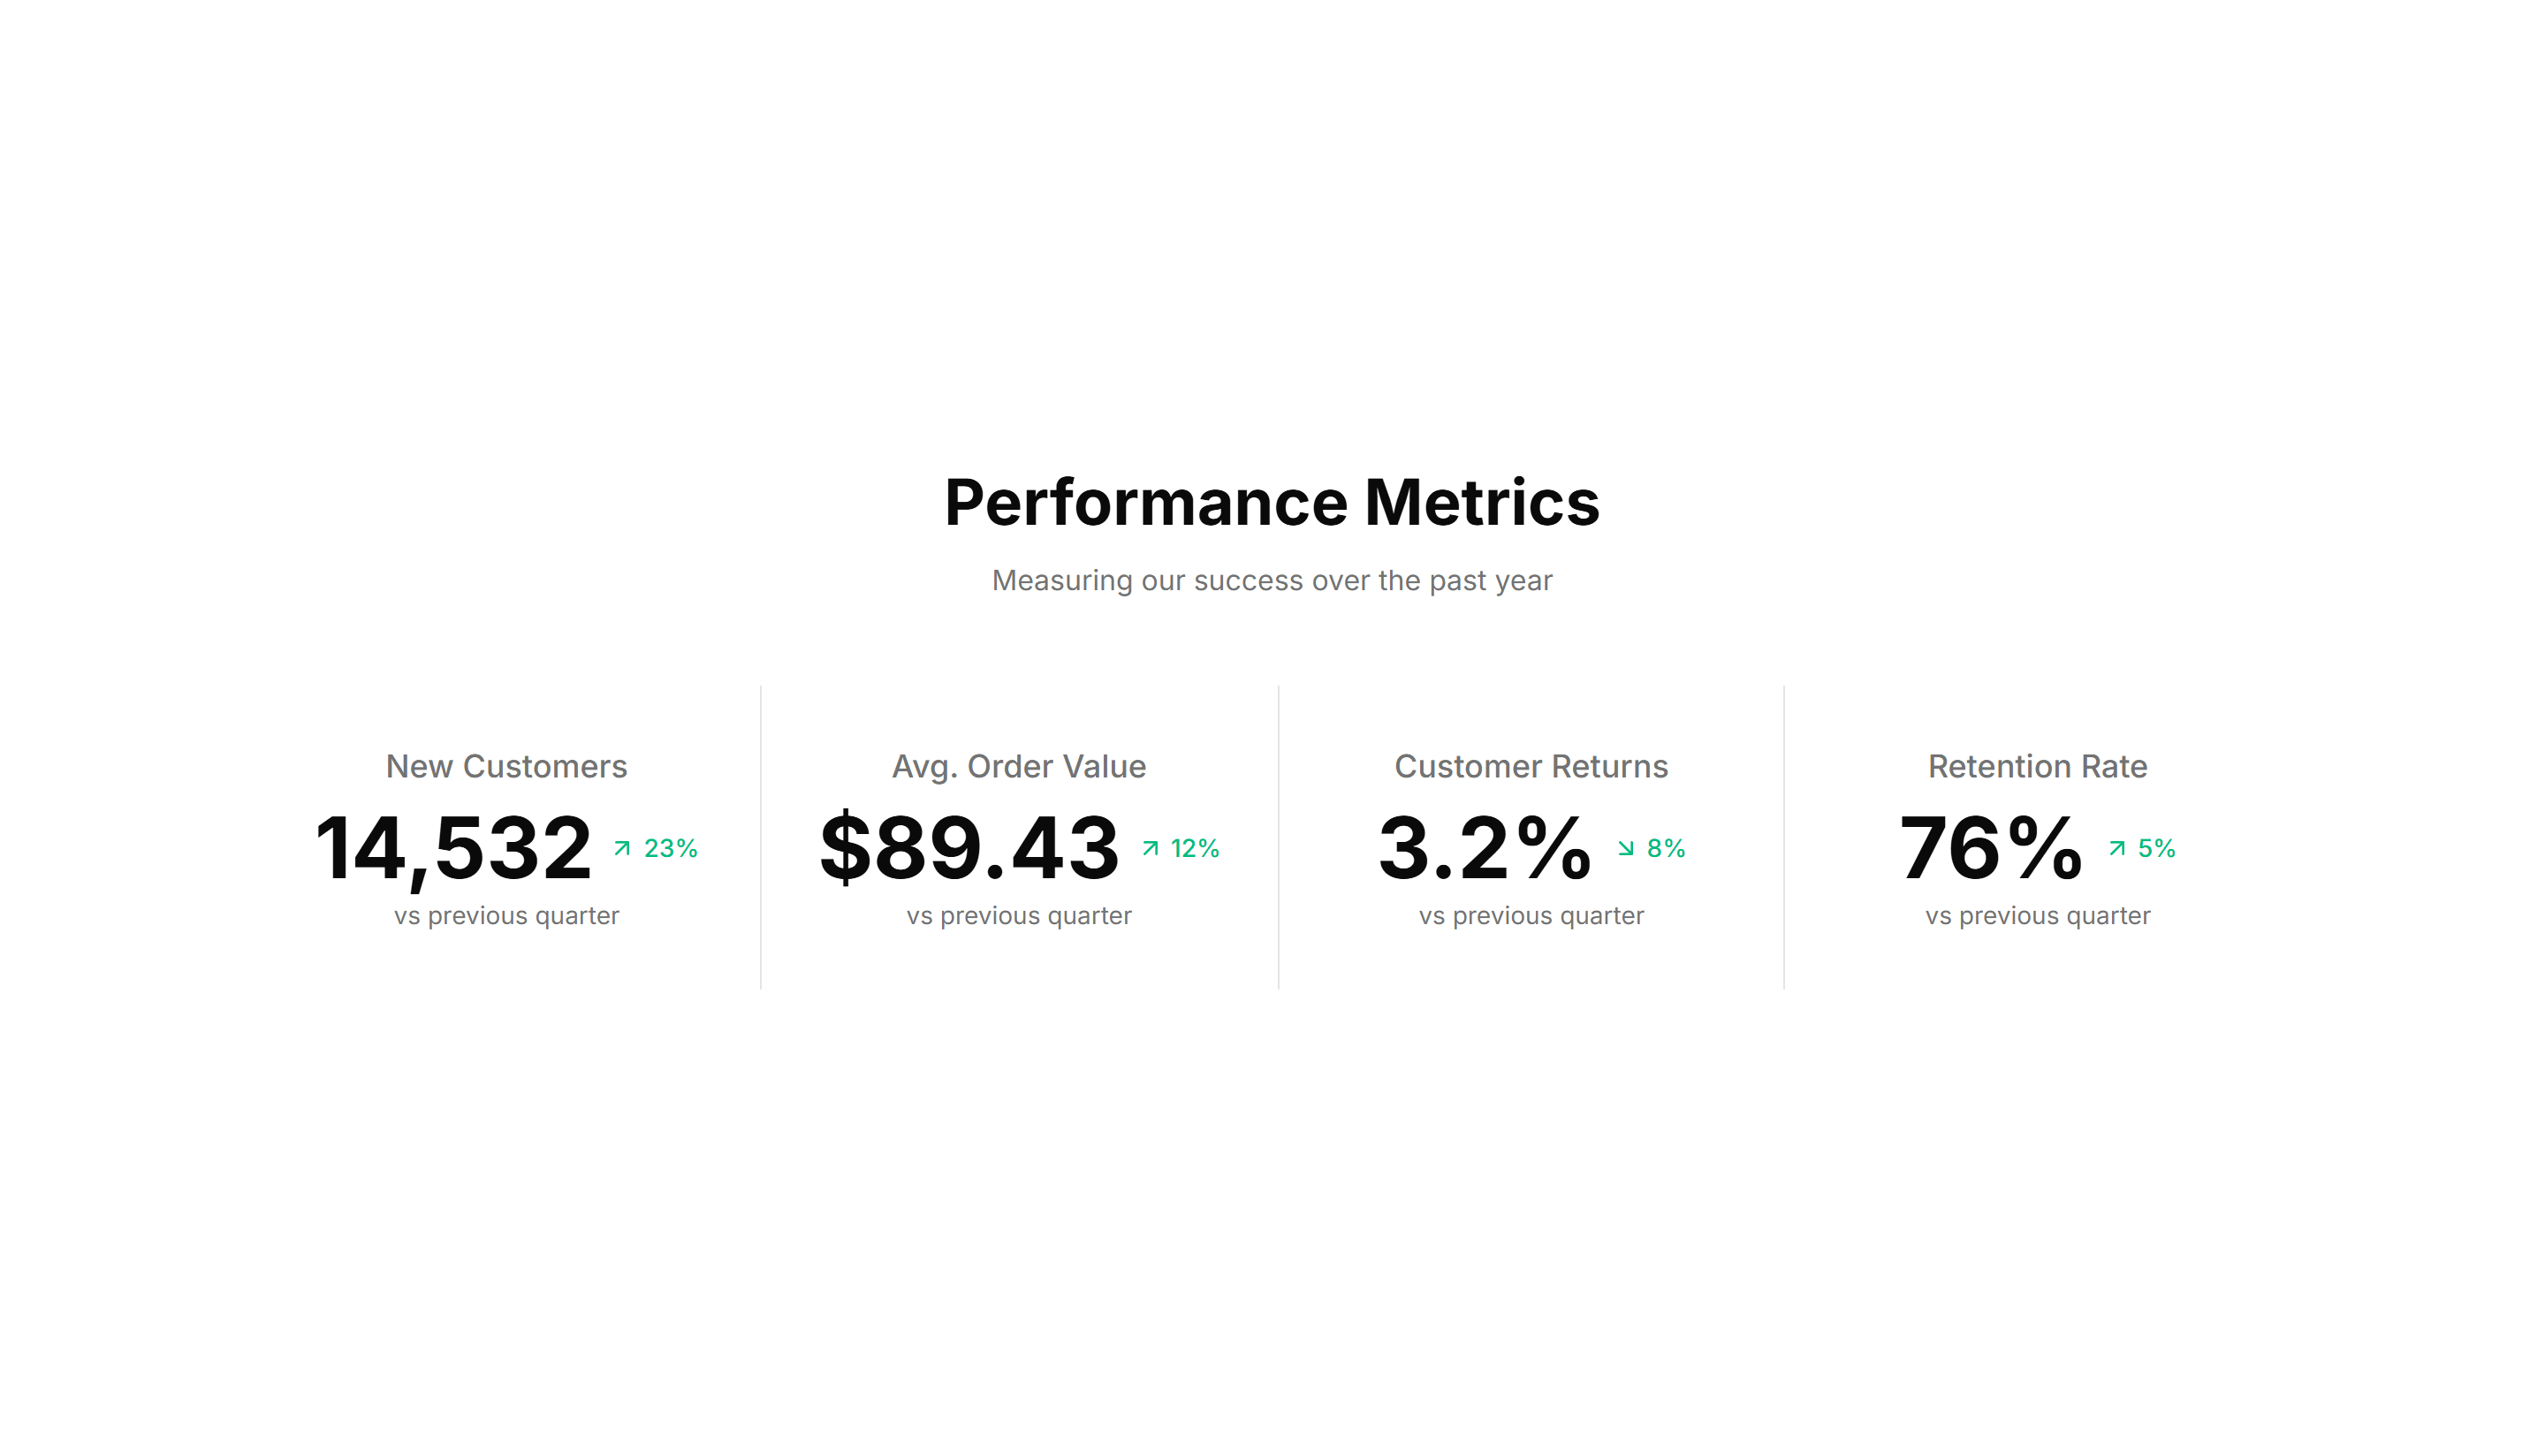
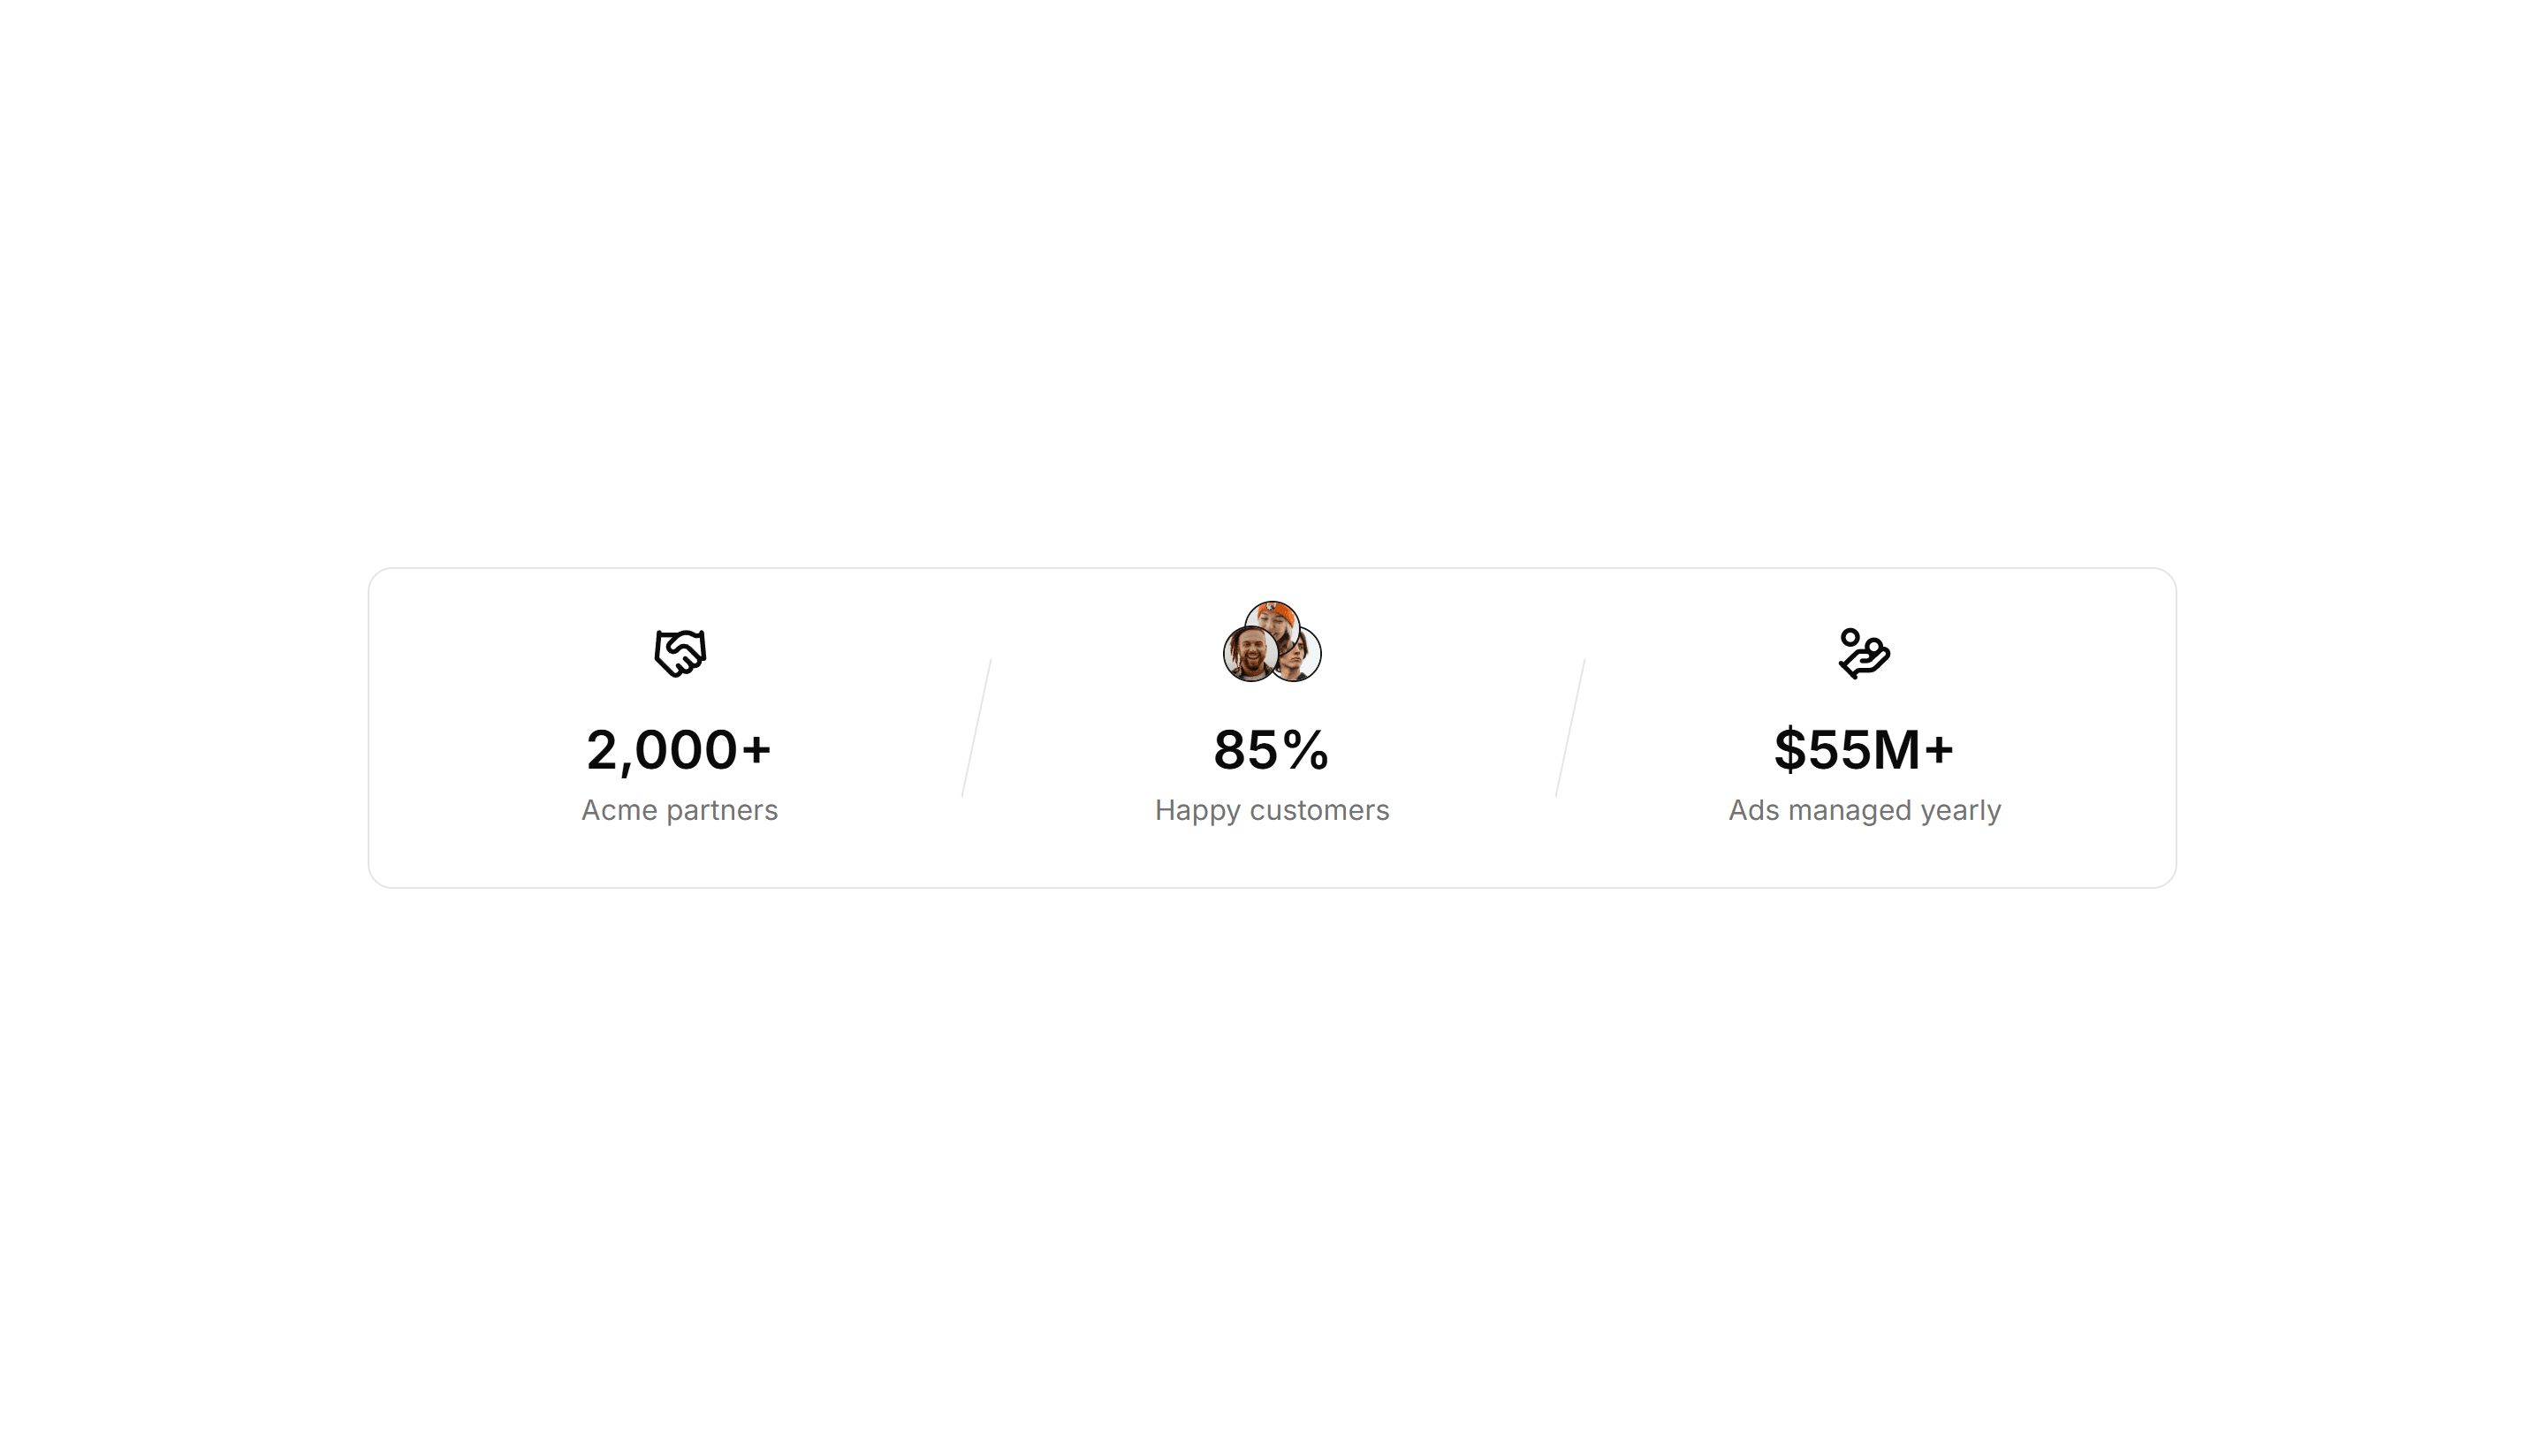
Marketing Stat: Horizontal With Dividers
A single row of figures split by thin vertical dividers for a tidy summary. Use it under a hero to surface three or four headline numbers fast.
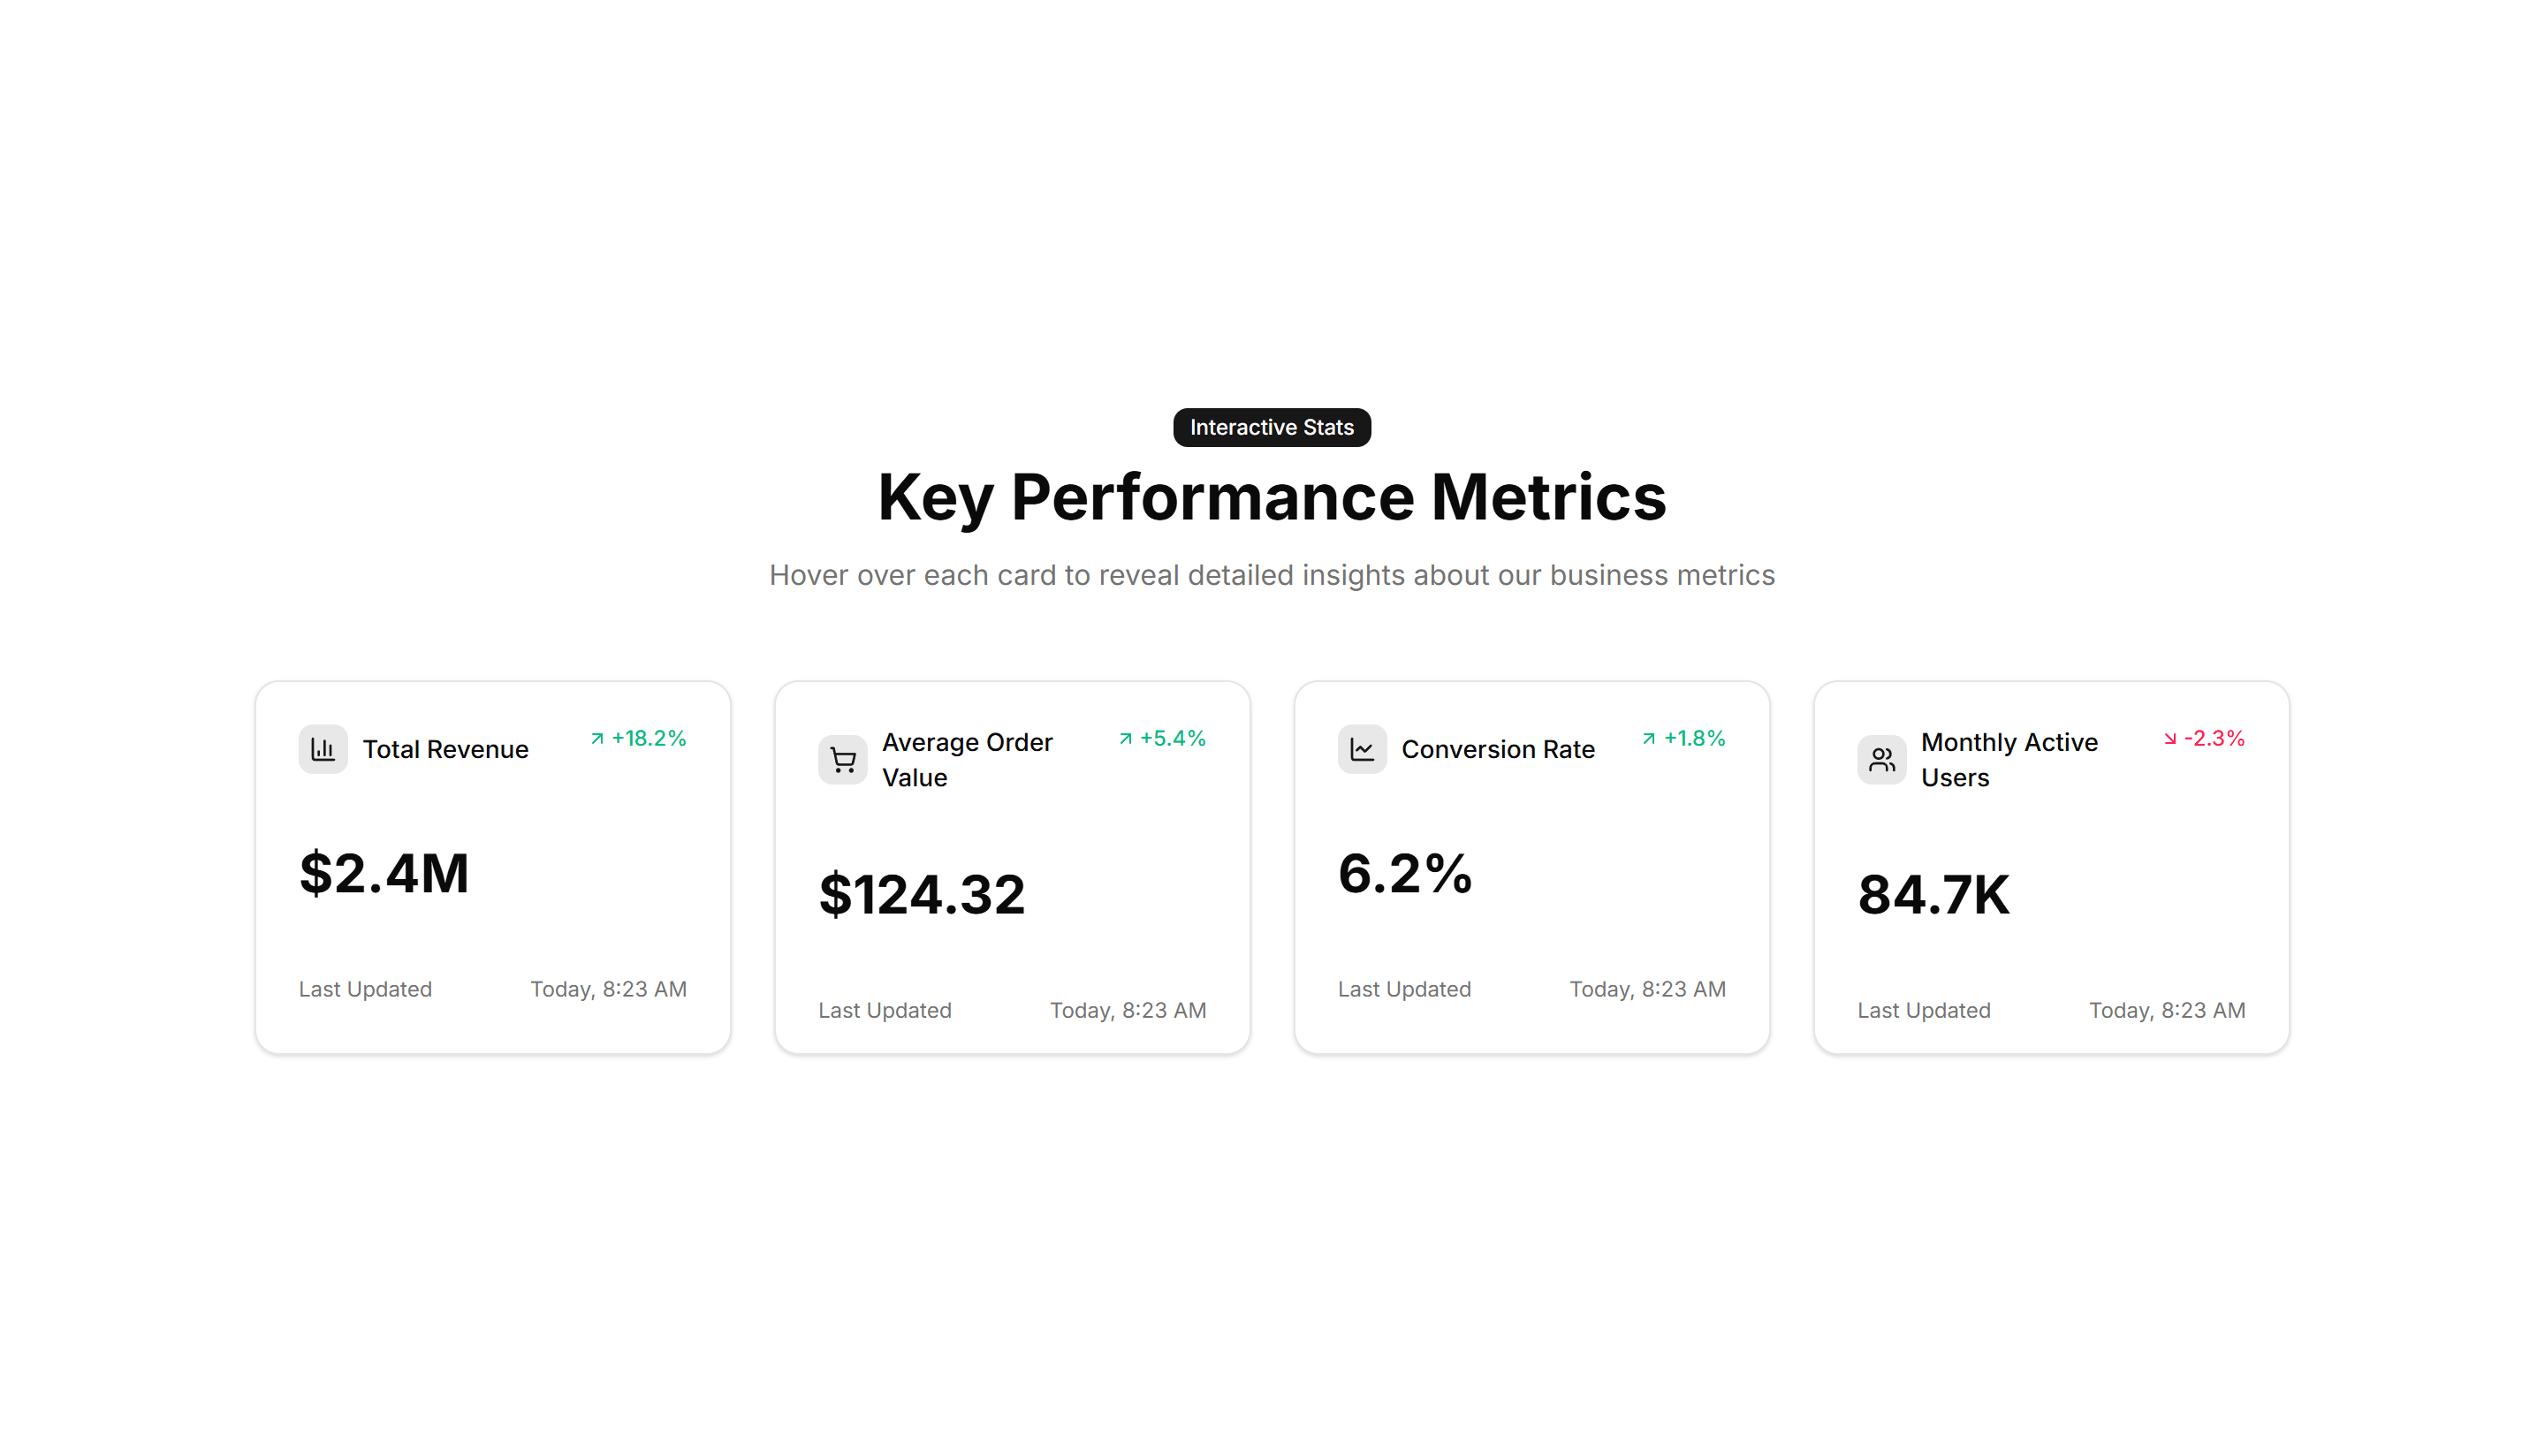
Marketing Stat: Interactive Hover
Stat cards that reveal extra detail or a chart when you hover over them. Use it when you want a number to expand into context on a feature page.
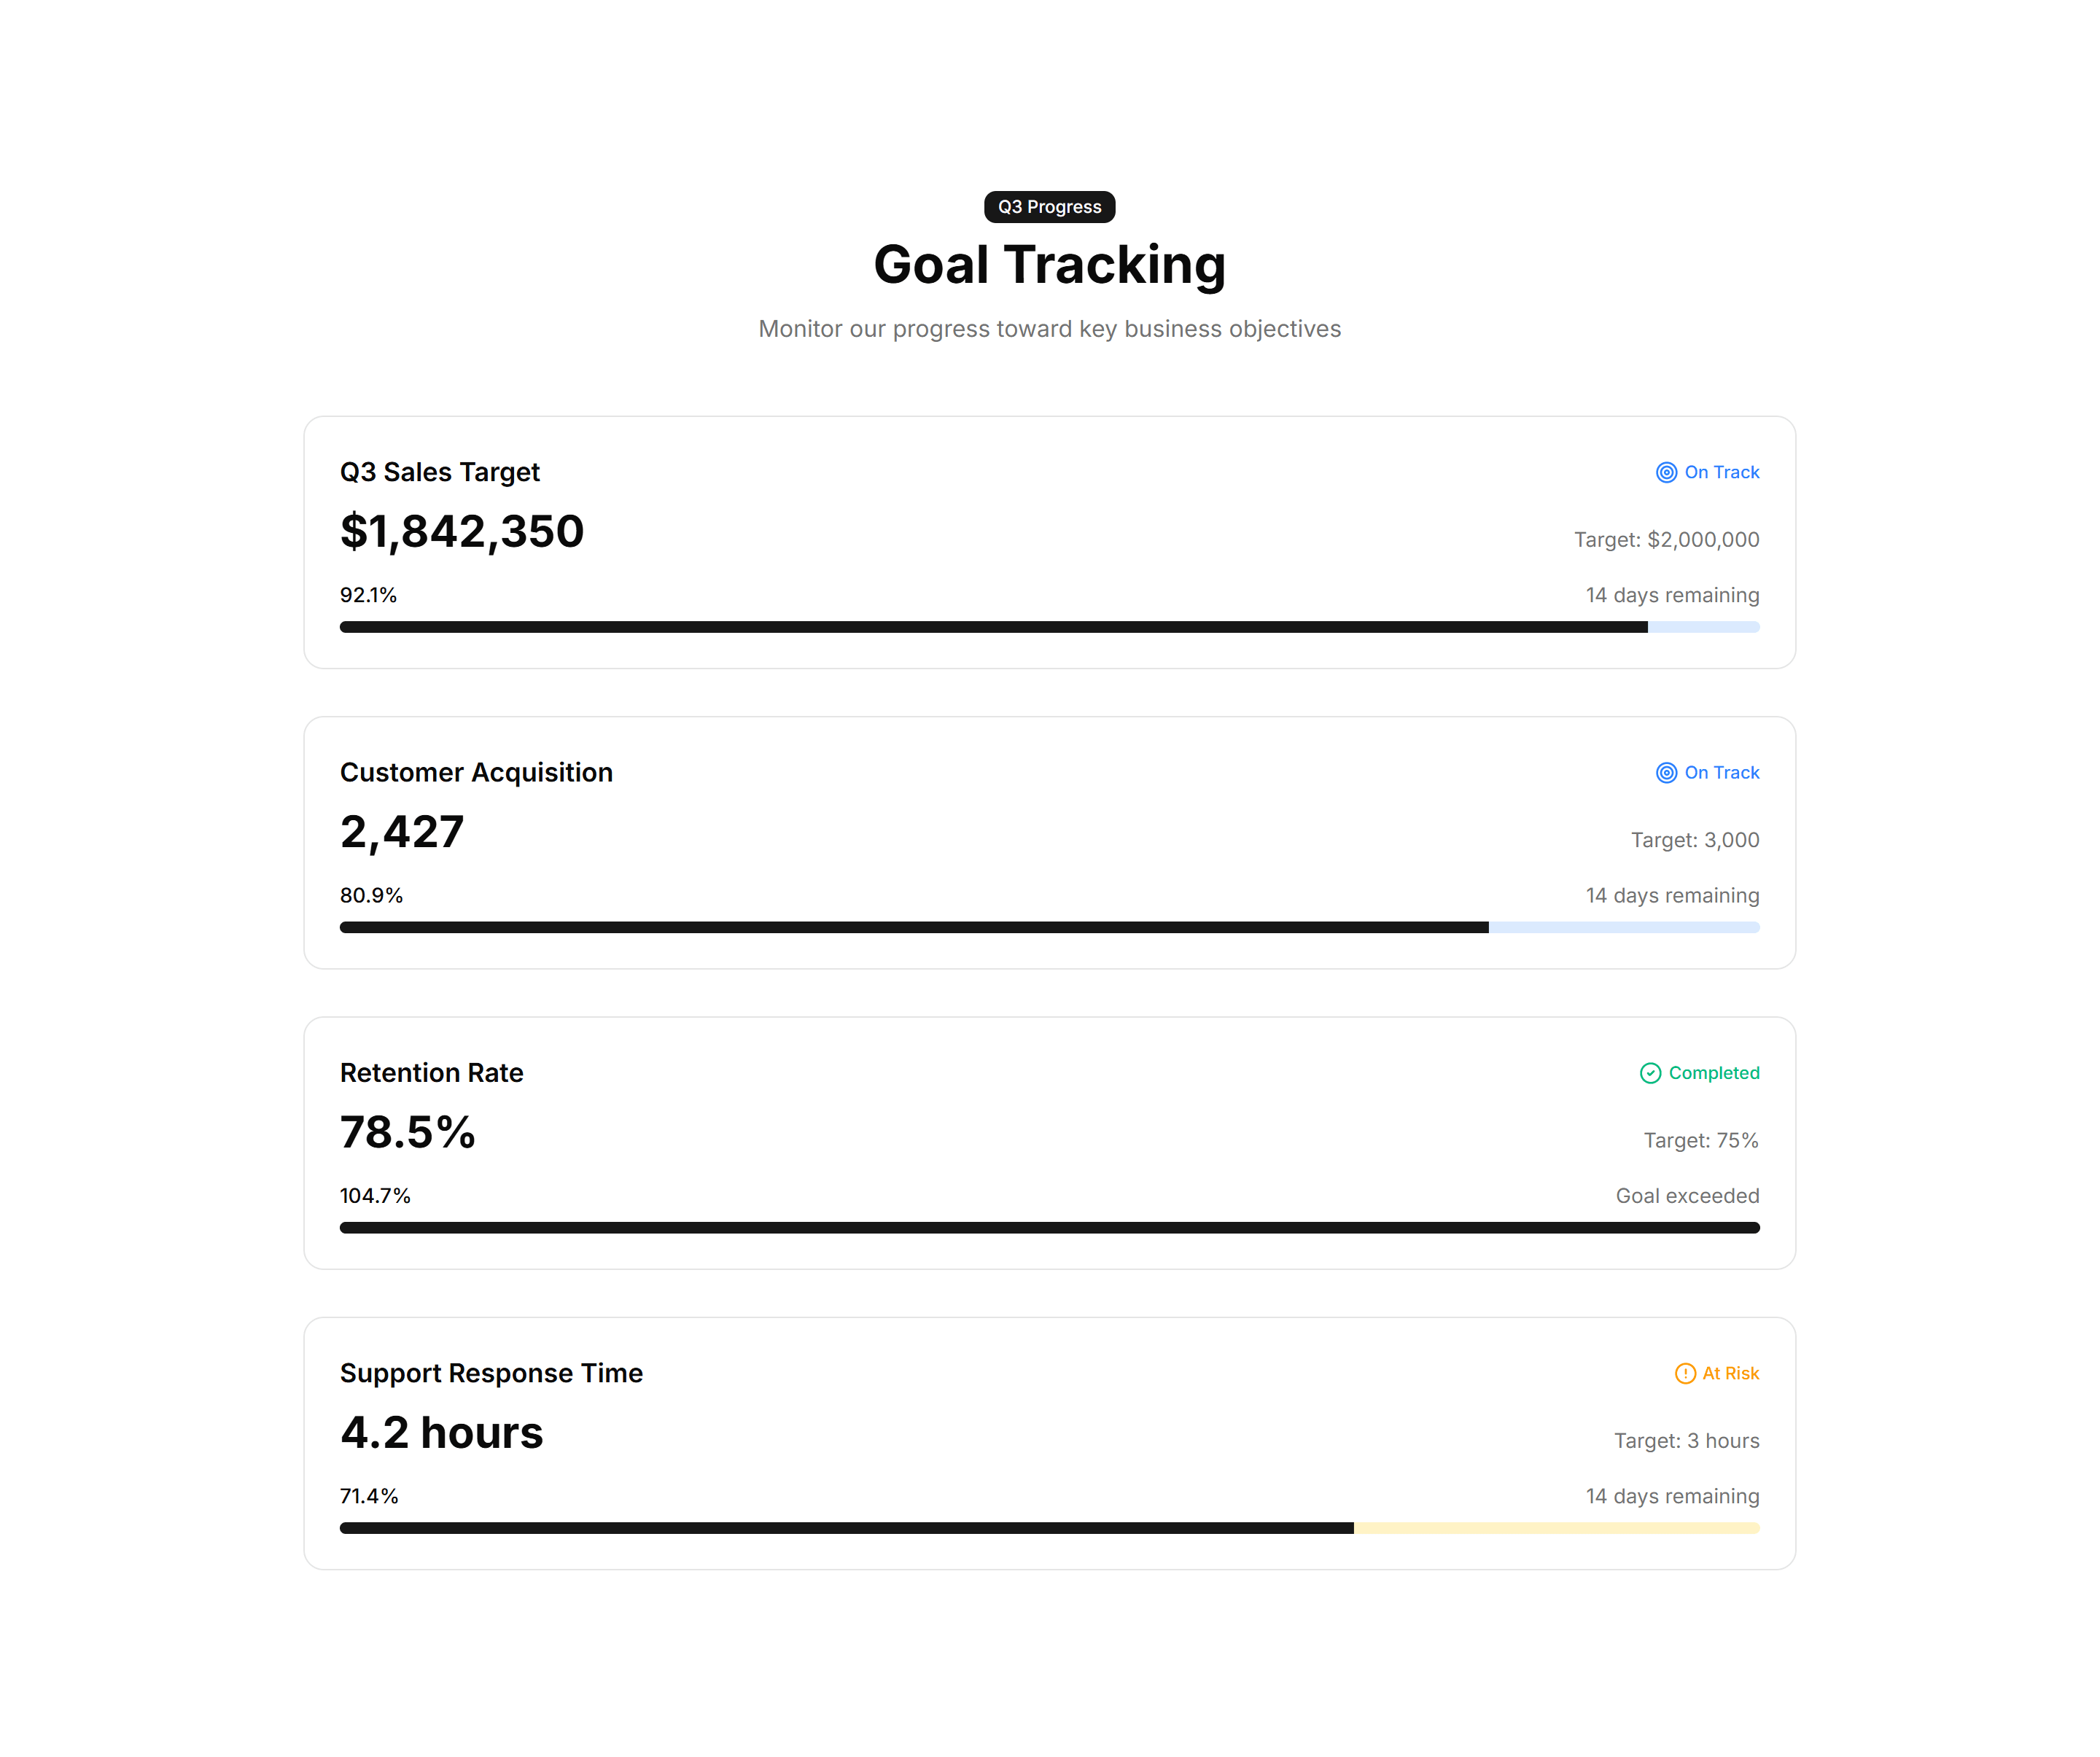
Marketing Stat: Achievement Bars
Horizontal bars that fill to show milestones reached against a target. Drop it on a results page to visualize goals hit and progress toward each one.